In May 2024, 34269, FL homes were selling for an average price of $321,073, 34269, FL homes on average sell after 81 days on the market compared to 78 days last year. There were 125 homes sold in 34269, FL for May 2024, compared to 125 last year.
The average list price of 34269, FL, was $400,851 in May 2024, compared to $369,061 in May 2023.
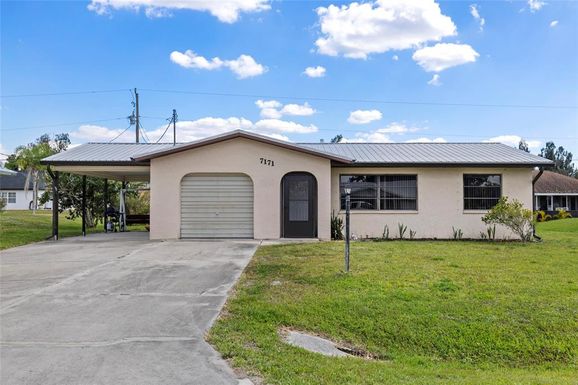
34269, FL Market Trend for Houses
Average List Price
The average list price of houses in 34269, FL, was $430,537 in May 2024, compared to $475,889 in May 2023.
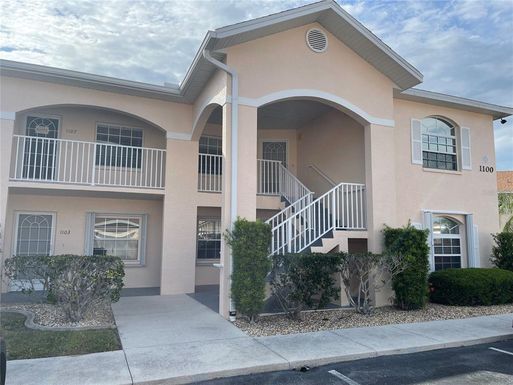
34269, FL Market Trend for Condos / Townhouses / Penthouses
Average List Price
The average list price of condos/co-ops in 34269, FL, was $232,933 in May 2024, compared to $212,388 in May 2023.
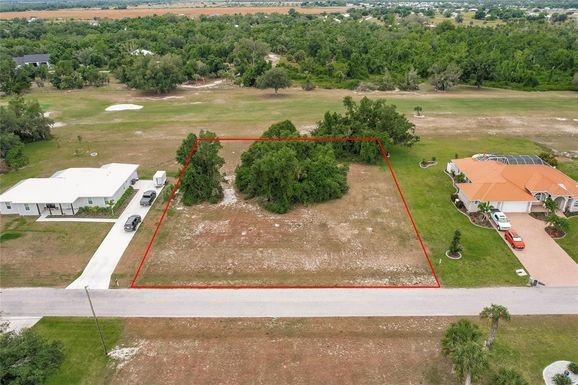
34269, FL Market Trend for Lots/Land
Average List Price
The average list price of lots/land in 34269, FL, was $494,915 in May 2024, compared to $378,388 in May 2023.
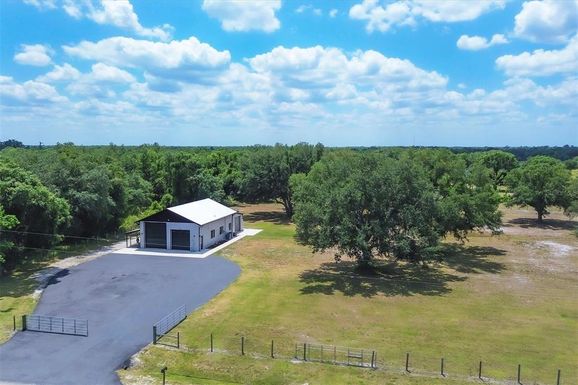
34269, FL Market Trend for Commercial
Average List Price
The average list price of commercial in 34269, FL, was $0 in May 2024, compared to $0 in May 2023.
34269, FL Housing Market Analysis
The average list price in 34269, FL is $400,851. The average list price in 34269, FL went up 4.71% from 2023 to 2024. 34269, FL home resale inventories is 76, which increased 65.22% since 2023. The average list price per square foot in 34269, FL is $282. 2023 it was $212.