In May 2024, 34266, FL homes were selling for an average price of $256,348, 34266, FL homes on average sell after 84 days on the market compared to 80 days last year. There were 350 homes sold in 34266, FL for May 2024, compared to 359 last year.
The average list price of 34266, FL, was $647,071 in May 2024, compared to $509,661 in May 2023.
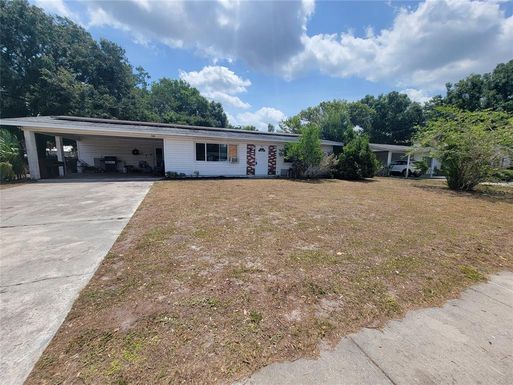
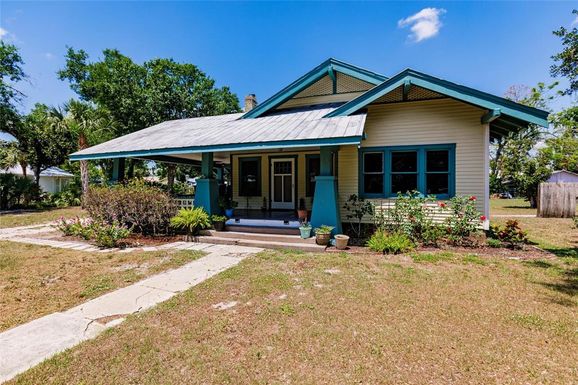
34266, FL Market Trend for Houses
Average List Price
The average list price of houses in 34266, FL, was $502,564 in May 2024, compared to $300,480 in May 2023.
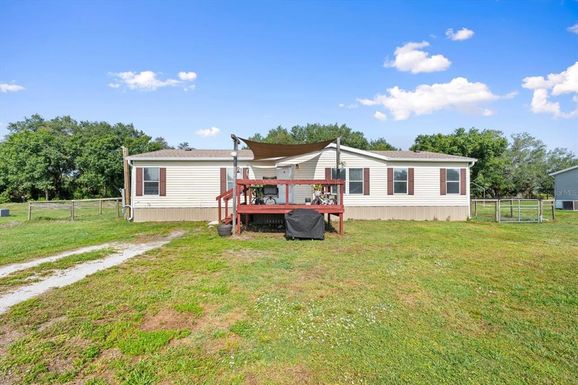
34266, FL Market Trend for Condos / Townhouses / Penthouses
Average List Price
The average list price of condos/co-ops in 34266, FL, was $0 in May 2024, compared to $0 in May 2023.
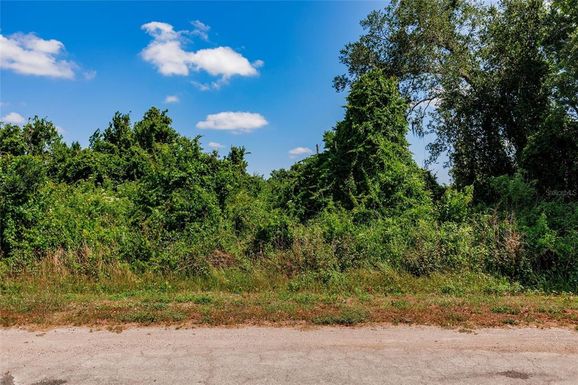
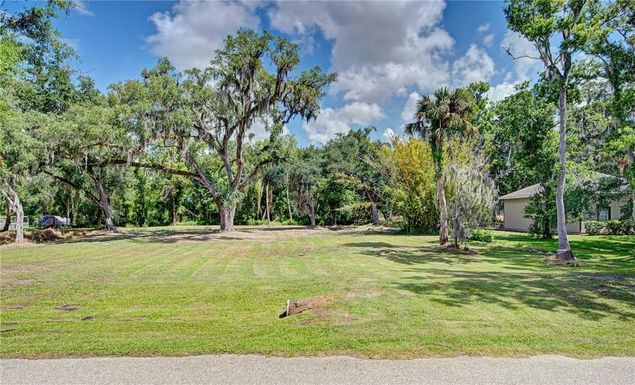
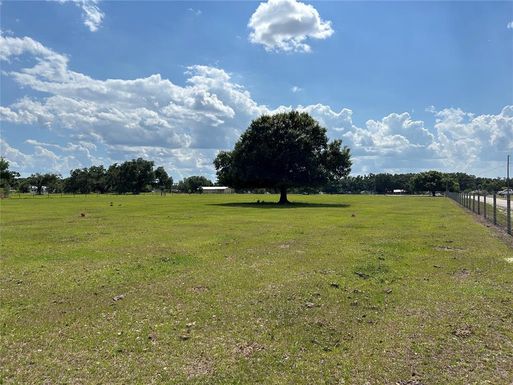
34266, FL Market Trend for Lots/Land
Average List Price
The average list price of lots/land in 34266, FL, was $761,850 in May 2024, compared to $595,849 in May 2023.
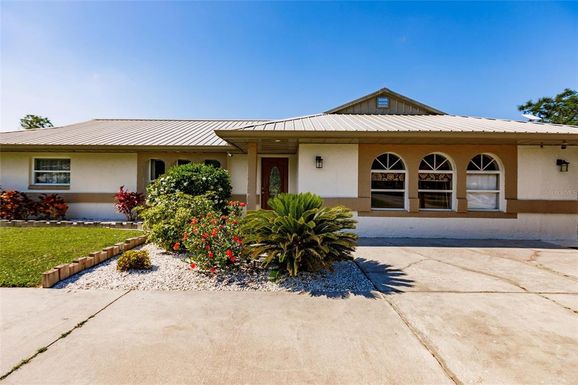
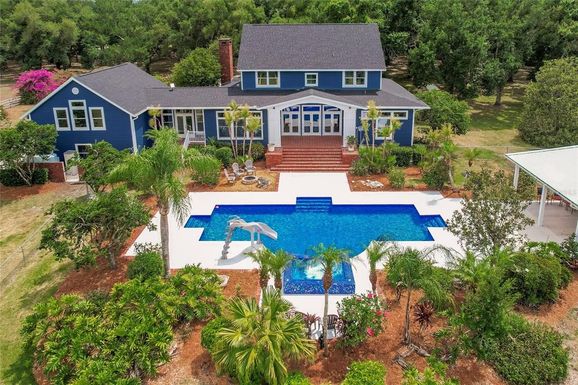
34266, FL Market Trend for Commercial
Average List Price
The average list price of commercial in 34266, FL, was $982,690 in May 2024, compared to $1,157,432 in May 2023.
34266, FL Housing Market Analysis
The average list price in 34266, FL is $647,071. The average list price in 34266, FL went up 27.56% from 2023 to 2024. 34266, FL home resale inventories is 153, which increased 10.07% since 2023. The average list price per square foot in 34266, FL is $273. 2023 it was $209.