In May 2024, 33983, FL homes were selling for an average price of $286,240, 33983, FL homes on average sell after 86 days on the market compared to 58 days last year. There were 767 homes sold in 33983, FL for May 2024, compared to 721 last year.
The average list price of 33983, FL, was $258,644 in May 2024, compared to $244,916 in May 2023.
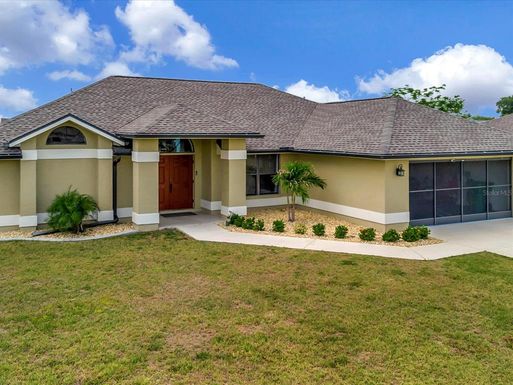
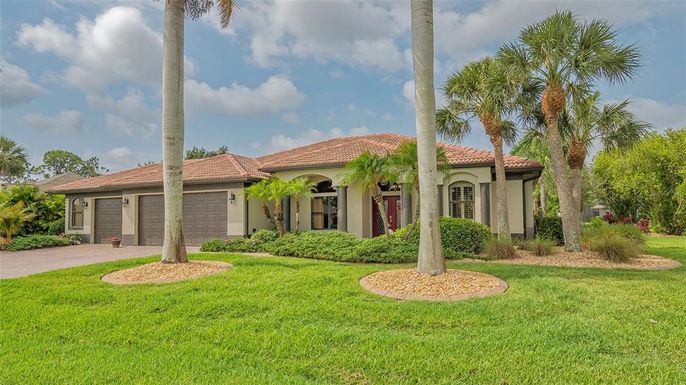
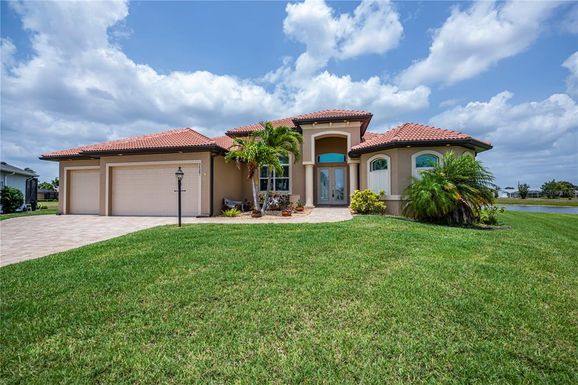
33983, FL Market Trend for Houses
Average List Price
The average list price of houses in 33983, FL, was $437,765 in May 2024, compared to $405,539 in May 2023.
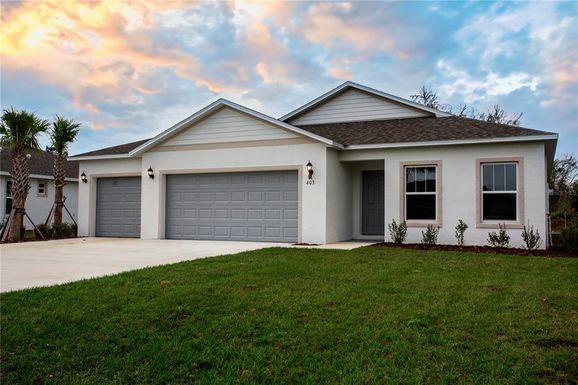
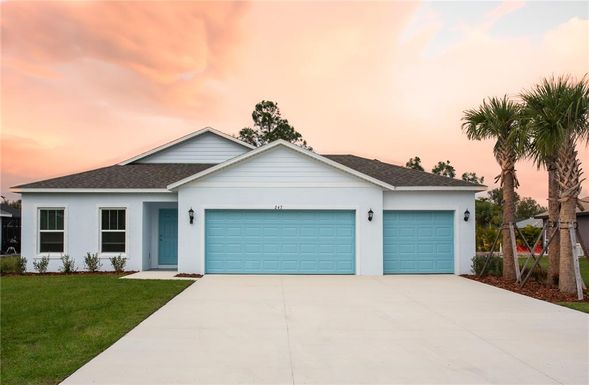
33983, FL Market Trend for Condos / Townhouses / Penthouses
Average List Price
The average list price of condos/co-ops in 33983, FL, was $220,880 in May 2024, compared to $217,483 in May 2023.
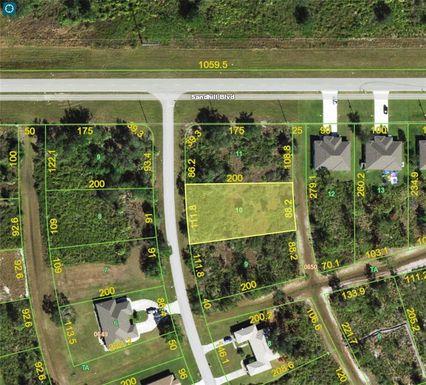
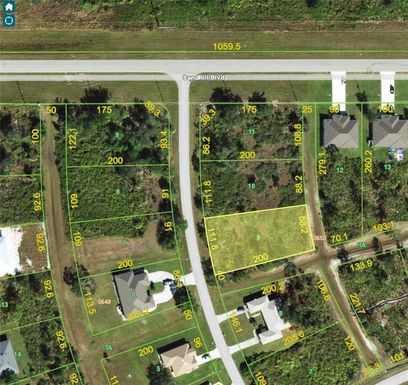
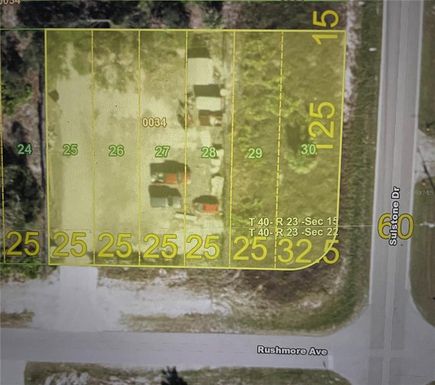
33983, FL Market Trend for Lots/Land
Average List Price
The average list price of lots/land in 33983, FL, was $68,099 in May 2024, compared to $57,625 in May 2023.
33983, FL Market Trend for Commercial
Average List Price
The average list price of commercial in 33983, FL, was $18,425 in May 2024, compared to $229,650 in May 2023.
33983, FL Housing Market Analysis
The average list price in 33983, FL is $258,644. The average list price in 33983, FL went up 10.73% from 2023 to 2024. 33983, FL home resale inventories is 430, which increased 28.36% since 2023. The average list price per square foot in 33983, FL is $214. 2023 it was $204.