In May 2024, 34286, FL homes were selling for an average price of $246,393, 34286, FL homes on average sell after 86 days on the market compared to 78 days last year. There were 66 homes sold in 34286, FL for May 2024, compared to 48 last year.
The average list price of 34286, FL, was $292,398 in May 2024, compared to $231,455 in May 2023.
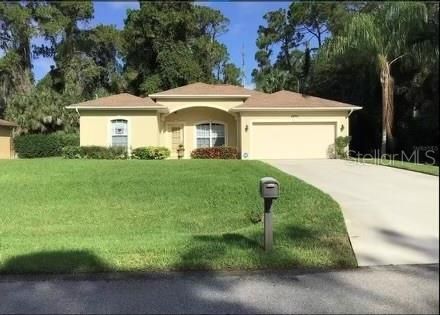
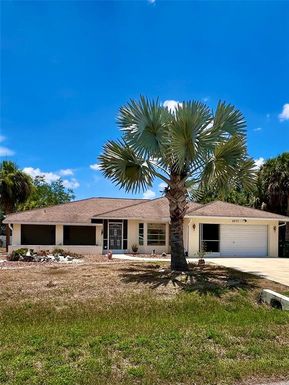
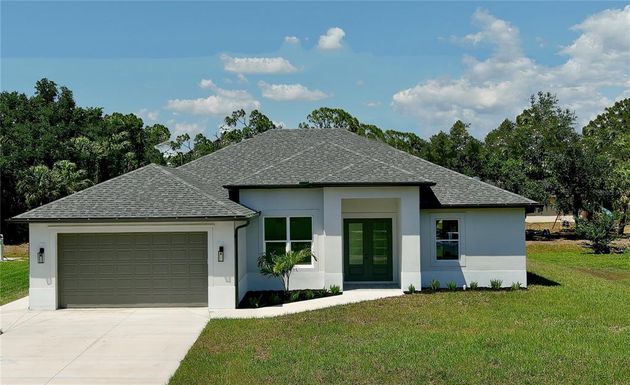
34286, FL Market Trend for Houses
Average List Price
The average list price of houses in 34286, FL, was $419,987 in May 2024, compared to $489,674 in May 2023.
34286, FL Market Trend for Condos / Townhouses / Penthouses
Average List Price
The average list price of condos/co-ops in 34286, FL, was $0 in May 2024, compared to $0 in May 2023.
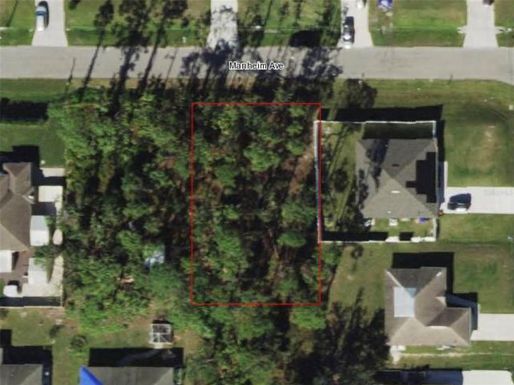
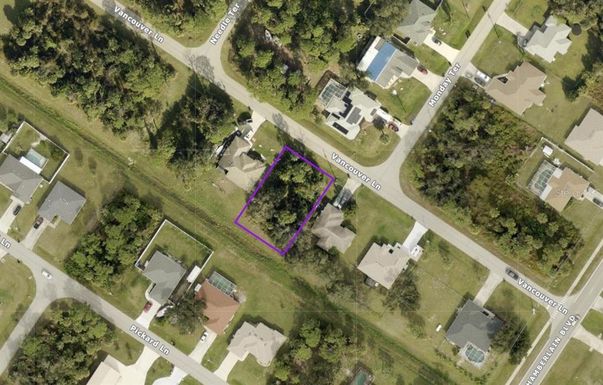
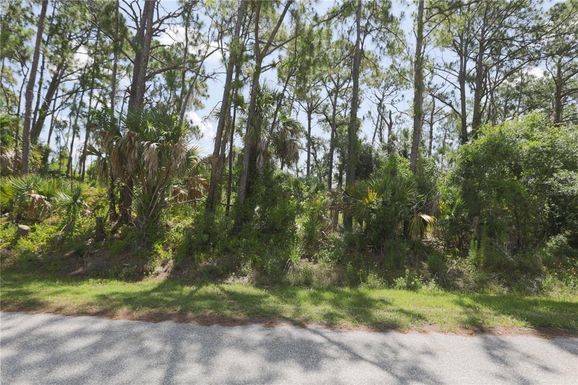
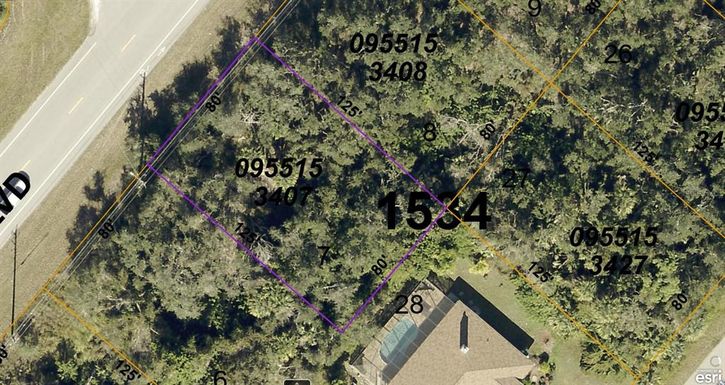
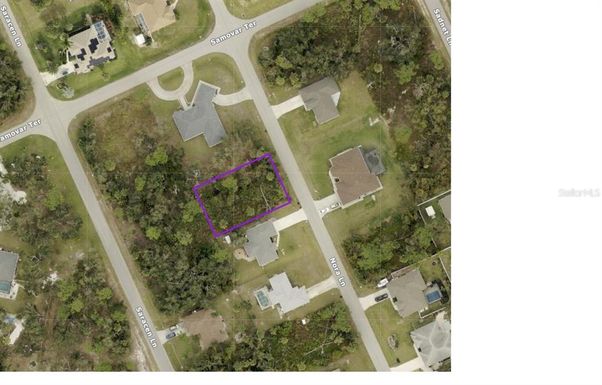
34286, FL Market Trend for Lots/Land
Average List Price
The average list price of lots/land in 34286, FL, was $82,228 in May 2024, compared to $113,488 in May 2023.
34286, FL Market Trend for Commercial
Average List Price
The average list price of commercial in 34286, FL, was $39,700 in May 2024, compared to $49,900 in May 2023.
34286, FL Housing Market Analysis
The average list price in 34286, FL is $292,398. The average list price in 34286, FL went up 26.33% from 2023 to 2024. 34286, FL home resale inventories is 274, which increased 705.88% since 2023. The average list price per square foot in 34286, FL is $238. 2023 it was $246.