In May 2024, 33948, FL homes were selling for an average price of $228,278, 33948, FL homes on average sell after 100 days on the market compared to 64 days last year. There were 810 homes sold in 33948, FL for May 2024, compared to 838 last year.
The average list price of 33948, FL, was $190,824 in May 2024, compared to $163,006 in May 2023.
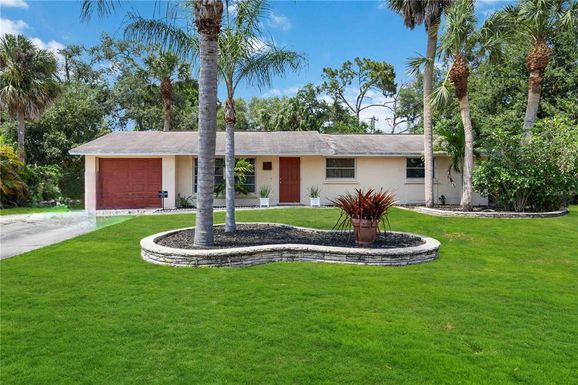
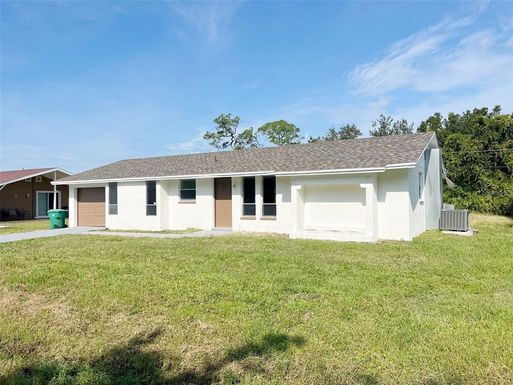
33948, FL Market Trend for Houses
Average List Price
The average list price of houses in 33948, FL, was $439,757 in May 2024, compared to $398,770 in May 2023.
33948, FL Market Trend for Condos / Townhouses / Penthouses
Average List Price
The average list price of condos/co-ops in 33948, FL, was $210,430 in May 2024, compared to $204,457 in May 2023.
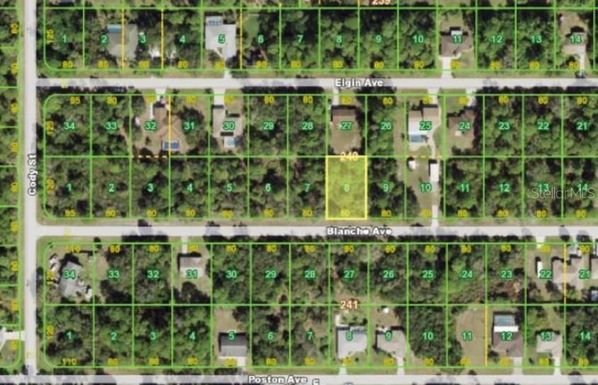
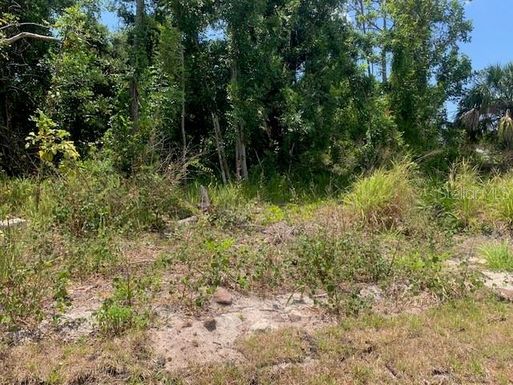
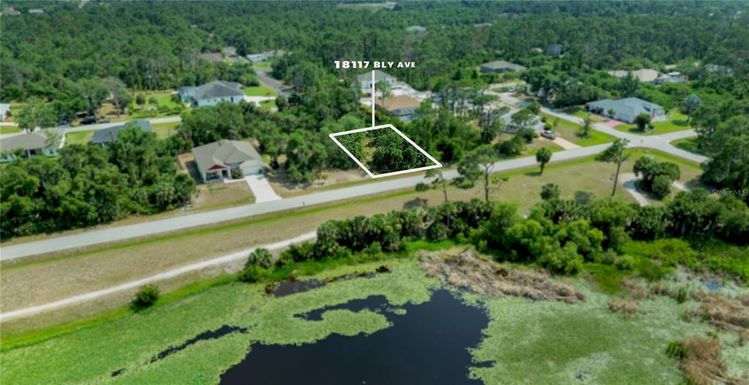
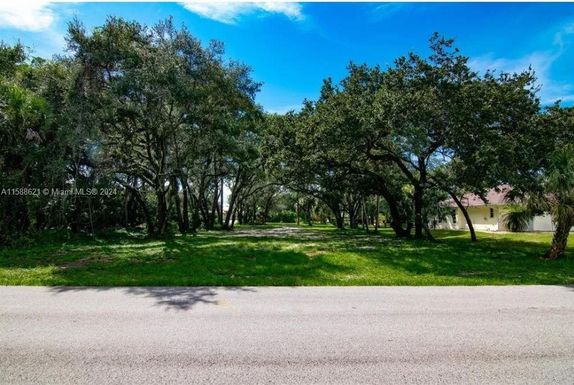
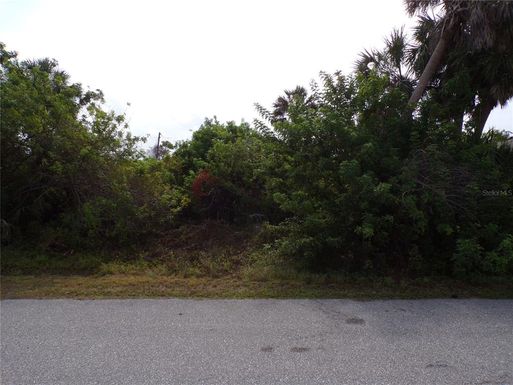
33948, FL Market Trend for Lots/Land
Average List Price
The average list price of lots/land in 33948, FL, was $55,753 in May 2024, compared to $49,291 in May 2023.
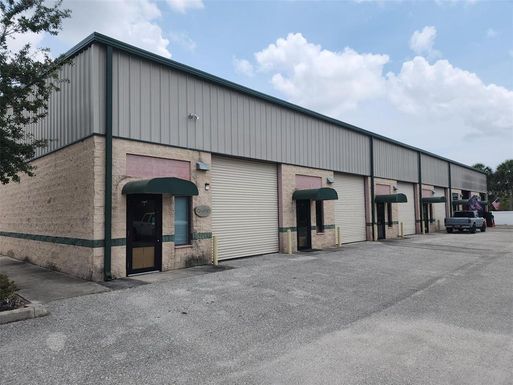
33948, FL Market Trend for Commercial
Average List Price
The average list price of commercial in 33948, FL, was $151,372 in May 2024, compared to $45,430 in May 2023.
33948, FL Housing Market Analysis
The average list price in 33948, FL is $190,824. The average list price in 33948, FL went up 20.62% from 2023 to 2024. 33948, FL home resale inventories is 826, which increased 91.20% since 2023. The average list price per square foot in 33948, FL is $243. 2023 it was $237.