In May 2024, 33954, FL homes were selling for an average price of $150,587, 33954, FL homes on average sell after 123 days on the market compared to 84 days last year. There were 719 homes sold in 33954, FL for May 2024, compared to 680 last year.
The average list price of 33954, FL, was $161,605 in May 2024, compared to $119,707 in May 2023.
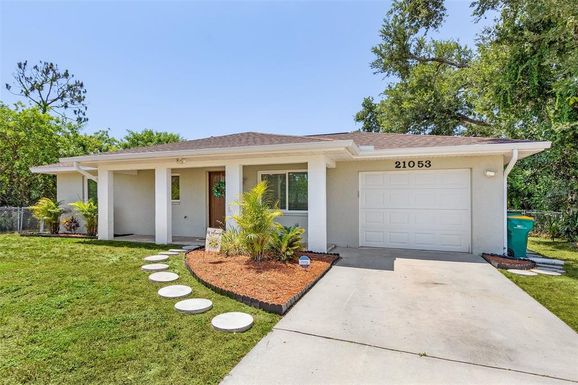
33954, FL Market Trend for Houses
Average List Price
The average list price of houses in 33954, FL, was $391,227 in May 2024, compared to $380,386 in May 2023.
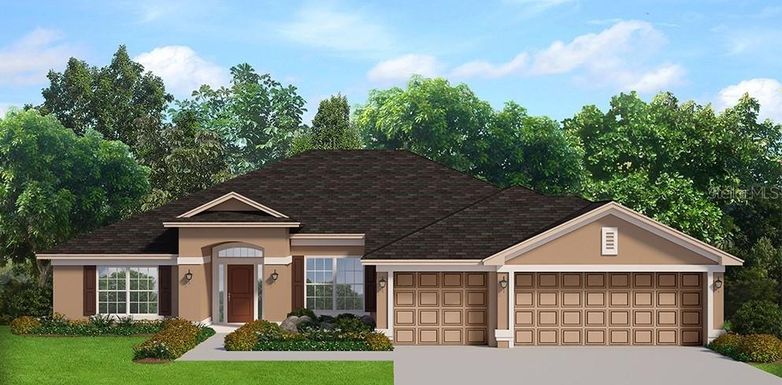
33954, FL Market Trend for Condos / Townhouses / Penthouses
Average List Price
The average list price of condos/co-ops in 33954, FL, was $0 in May 2024, compared to $0 in May 2023.
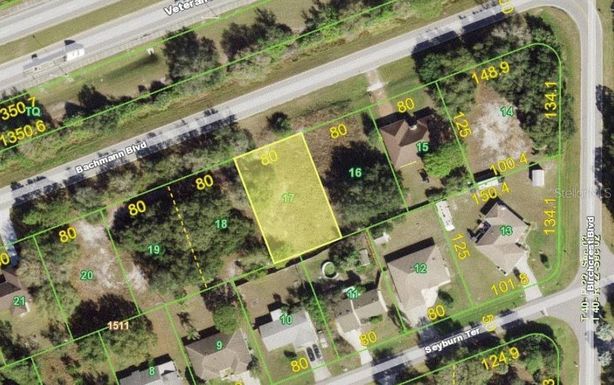
33954, FL Market Trend for Lots/Land
Average List Price
The average list price of lots/land in 33954, FL, was $46,152 in May 2024, compared to $40,869 in May 2023.
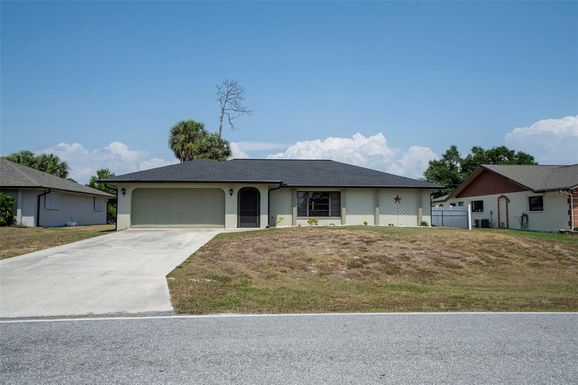
33954, FL Market Trend for Commercial
Average List Price
The average list price of commercial in 33954, FL, was $150,410 in May 2024, compared to $102,375 in May 2023.
33954, FL Housing Market Analysis
The average list price in 33954, FL is $161,605. The average list price in 33954, FL went up 34.37% from 2023 to 2024. 33954, FL home resale inventories is 523, which increased 33.76% since 2023. The average list price per square foot in 33954, FL is $223. 2023 it was $225.