In May 2024, 34224, FL homes were selling for an average price of $269,167, 34224, FL homes on average sell after 74 days on the market compared to 43 days last year. There were 692 homes sold in 34224, FL for May 2024, compared to 739 last year.
The average list price of 34224, FL, was $258,546 in May 2024, compared to $268,601 in May 2023.
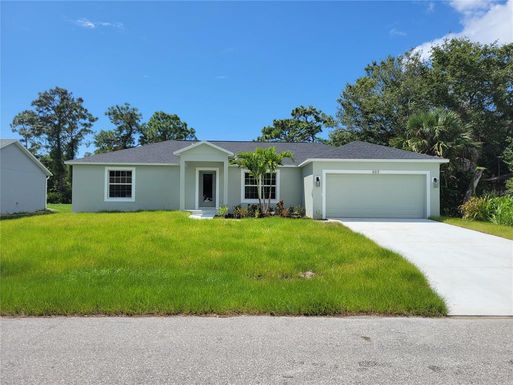
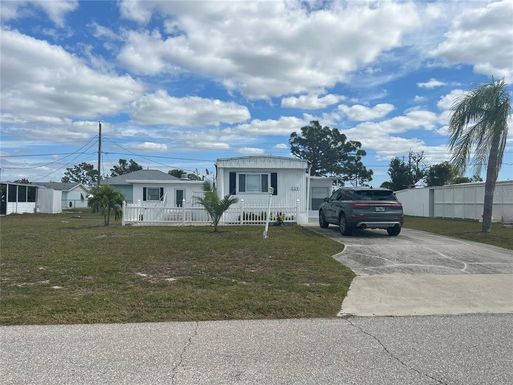
34224, FL Market Trend for Houses
Average List Price
The average list price of houses in 34224, FL, was $547,099 in May 2024, compared to $455,847 in May 2023.
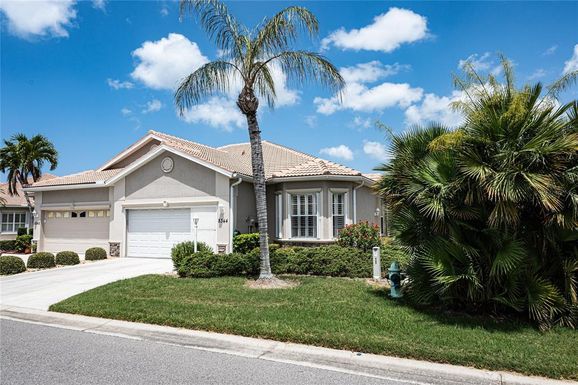
34224, FL Market Trend for Condos / Townhouses / Penthouses
Average List Price
The average list price of condos/co-ops in 34224, FL, was $334,346 in May 2024, compared to $383,958 in May 2023.
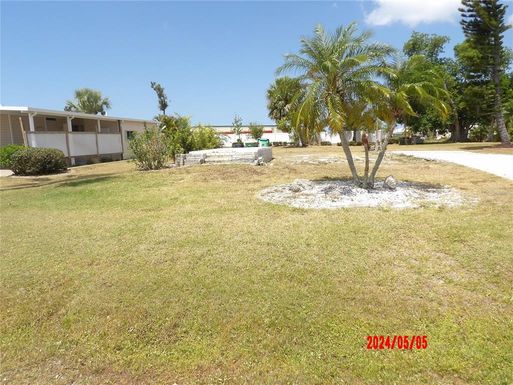
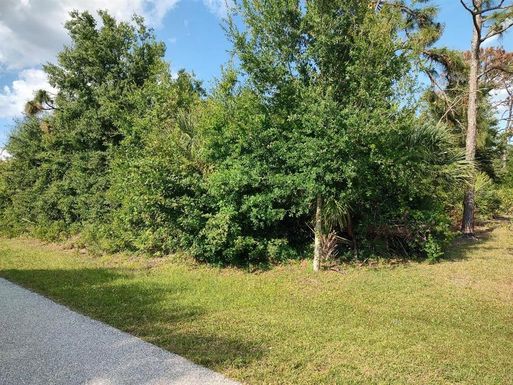
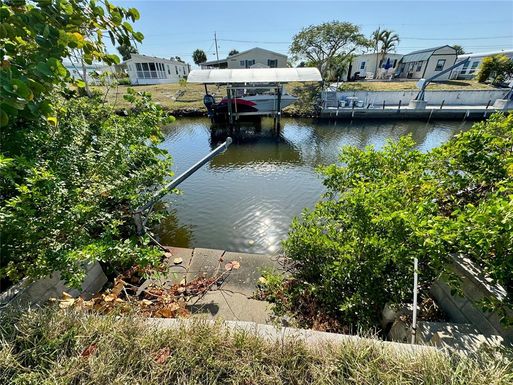
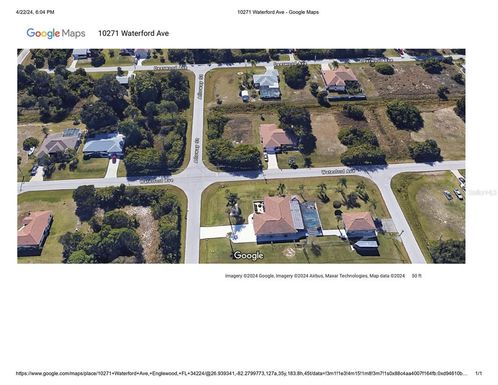
34224, FL Market Trend for Lots/Land
Average List Price
The average list price of lots/land in 34224, FL, was $119,694 in May 2024, compared to $108,662 in May 2023.
34224, FL Market Trend for Commercial
Average List Price
The average list price of commercial in 34224, FL, was $362,200 in May 2024, compared to $829,725 in May 2023.
34224, FL Housing Market Analysis
The average list price in 34224, FL is $258,546. The average list price in 34224, FL went down 3.92% from 2023 to 2024. 34224, FL home resale inventories is 357, which increased 45.12% since 2023. The average list price per square foot in 34224, FL is $267. 2023 it was $251.