In May 2024, 33953, FL homes were selling for an average price of $182,987, 33953, FL homes on average sell after 150 days on the market compared to 83 days last year. There were 976 homes sold in 33953, FL for May 2024, compared to 978 last year.
The average list price of 33953, FL, was $113,005 in May 2024, compared to $124,308 in May 2023.
33953, FL Market Trend for Houses
Average List Price
The average list price of houses in 33953, FL, was $518,383 in May 2024, compared to $417,409 in May 2023.
33953, FL Market Trend for Condos / Townhouses / Penthouses
Average List Price
The average list price of condos/co-ops in 33953, FL, was $328,460 in May 2024, compared to $281,953 in May 2023.
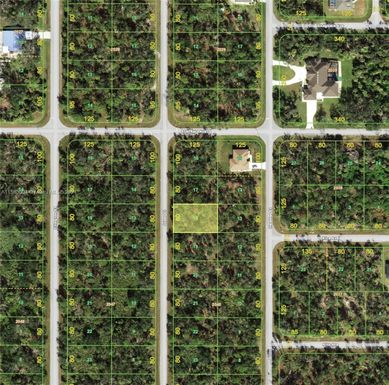
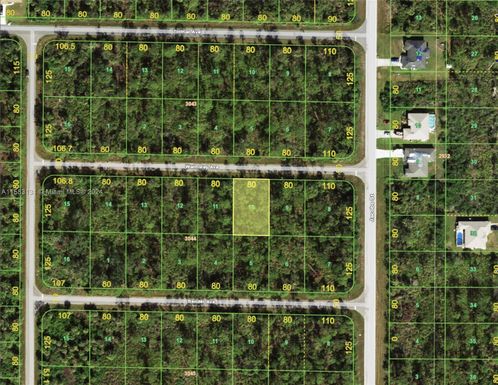
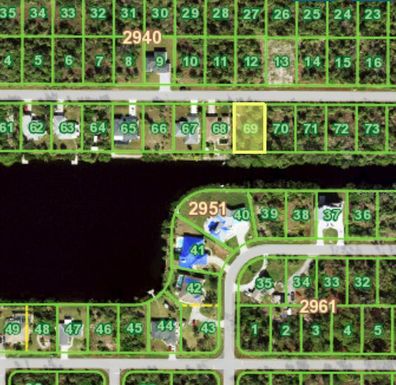
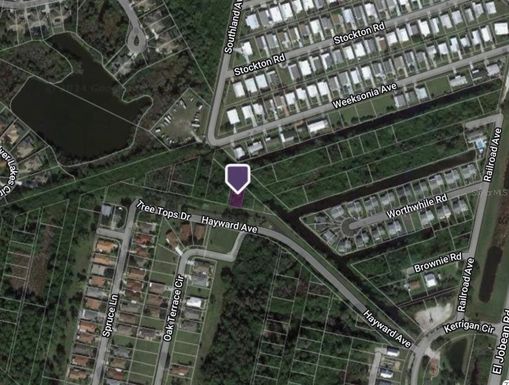
33953, FL Market Trend for Lots/Land
Average List Price
The average list price of lots/land in 33953, FL, was $47,498 in May 2024, compared to $42,867 in May 2023.
33953, FL Market Trend for Commercial
Average List Price
The average list price of commercial in 33953, FL, was $207,423 in May 2024, compared to $475,328 in May 2023.
33953, FL Housing Market Analysis
The average list price in 33953, FL is $113,005. The average list price in 33953, FL went down 6.84% from 2023 to 2024. 33953, FL home resale inventories is 940, which increased 47.10% since 2023. The average list price per square foot in 33953, FL is $265. 2023 it was $220.