In May 2024, 33946, FL homes were selling for an average price of $237,535, 33946, FL homes on average sell after 271 days on the market compared to 102 days last year. There were 36 homes sold in 33946, FL for May 2024, compared to 31 last year.
The average list price of 33946, FL, was $366,318 in May 2024, compared to $129,854 in May 2023.
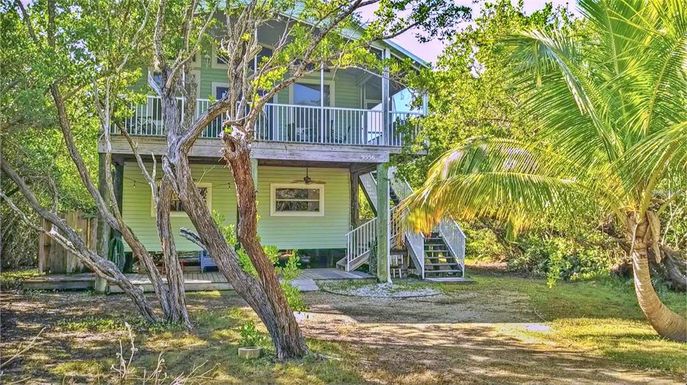
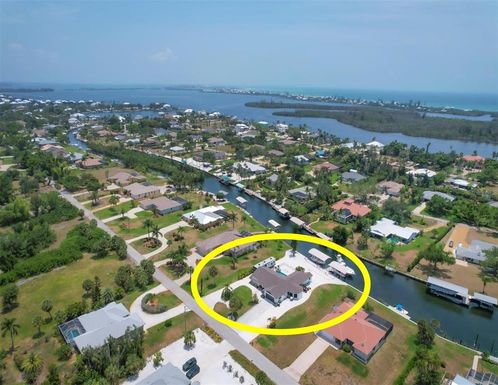
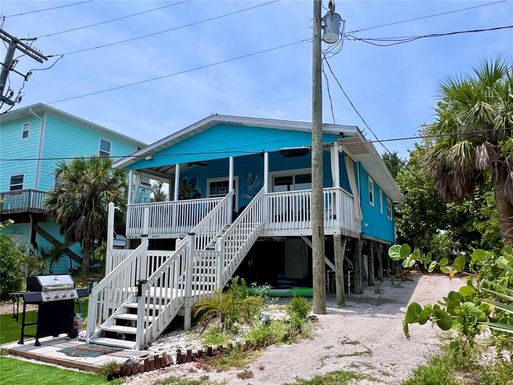
33946, FL Market Trend for Houses
Average List Price
The average list price of houses in 33946, FL, was $1,023,800 in May 2024, compared to $1,716,333 in May 2023.
33946, FL Market Trend for Condos / Townhouses / Penthouses
Average List Price
The average list price of condos/co-ops in 33946, FL, was $549,109 in May 2024, compared to $359,500 in May 2023.
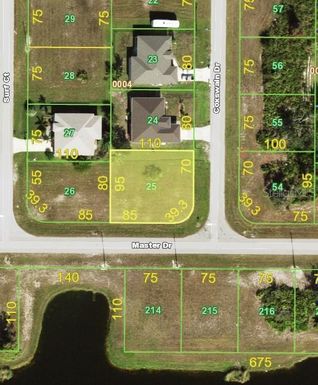
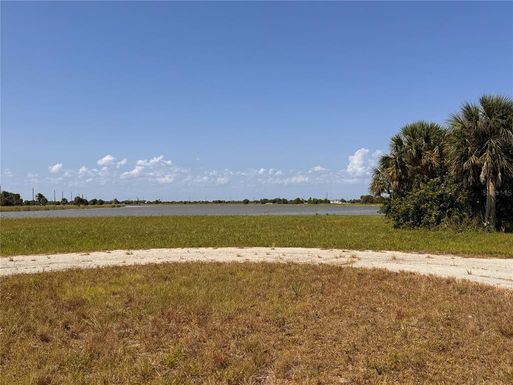
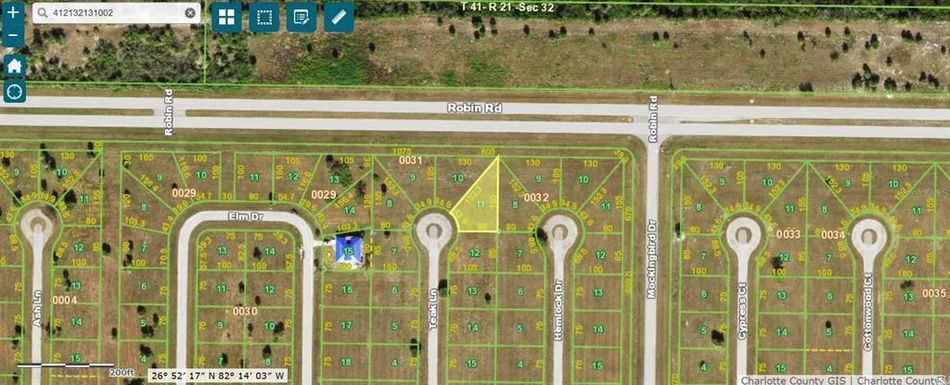
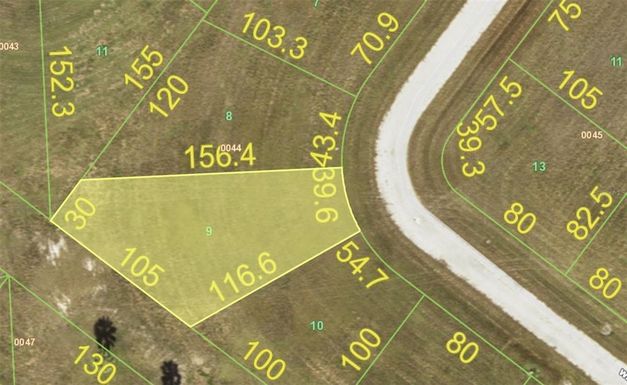
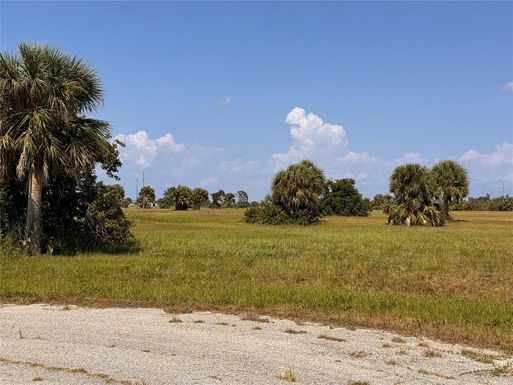
33946, FL Market Trend for Lots/Land
Average List Price
The average list price of lots/land in 33946, FL, was $50,347 in May 2024, compared to $31,119 in May 2023.
33946, FL Market Trend for Commercial
Average List Price
The average list price of commercial in 33946, FL, was $47,624 in May 2024, compared to $38,250 in May 2023.
33946, FL Housing Market Analysis
The average list price in 33946, FL is $366,318. The average list price in 33946, FL went up 182.10% from 2023 to 2024. 33946, FL home resale inventories is 203, which increased 250.00% since 2023. The average list price per square foot in 33946, FL is $434. 2023 it was $501.