In May 2024, 34223, FL homes were selling for an average price of $609,567, 34223, FL homes on average sell after 76 days on the market compared to 43 days last year. There were 640 homes sold in 34223, FL for May 2024, compared to 609 last year.
The average list price of 34223, FL, was $775,965 in May 2024, compared to $667,763 in May 2023.
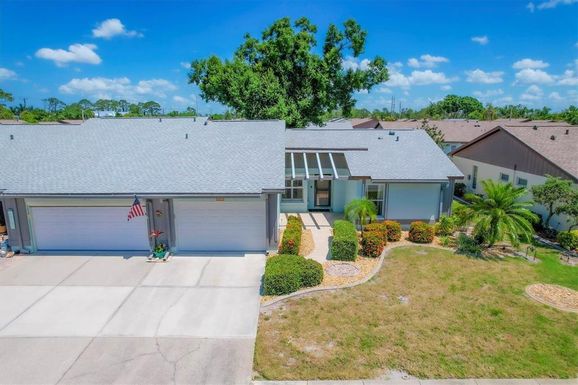
34223, FL Market Trend for Houses
Average List Price
The average list price of houses in 34223, FL, was $954,130 in May 2024, compared to $804,165 in May 2023.
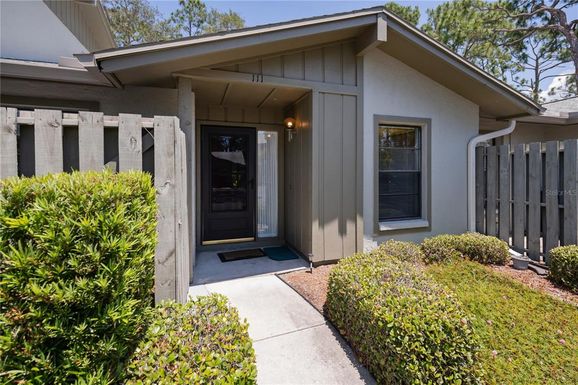
34223, FL Market Trend for Condos / Townhouses / Penthouses
Average List Price
The average list price of condos/co-ops in 34223, FL, was $489,926 in May 2024, compared to $430,239 in May 2023.
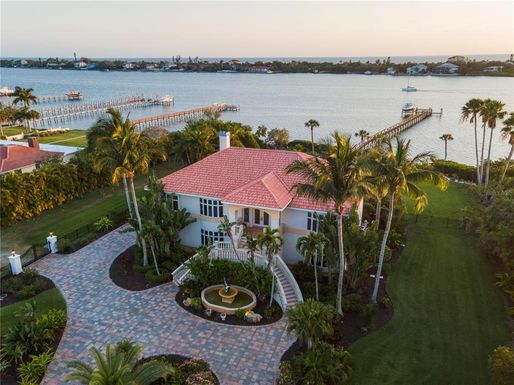
34223, FL Market Trend for Lots/Land
Average List Price
The average list price of lots/land in 34223, FL, was $468,719 in May 2024, compared to $521,855 in May 2023.
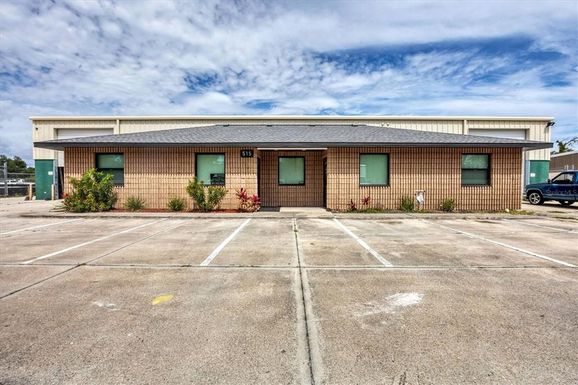
34223, FL Market Trend for Commercial
Average List Price
The average list price of commercial in 34223, FL, was $1,129,828 in May 2024, compared to $638,914 in May 2023.
34223, FL Housing Market Analysis
The average list price in 34223, FL is $775,965. The average list price in 34223, FL went up 21.42% from 2023 to 2024. 34223, FL home resale inventories is 308, which increased 51.72% since 2023. The average list price per square foot in 34223, FL is $421. 2023 it was $362.