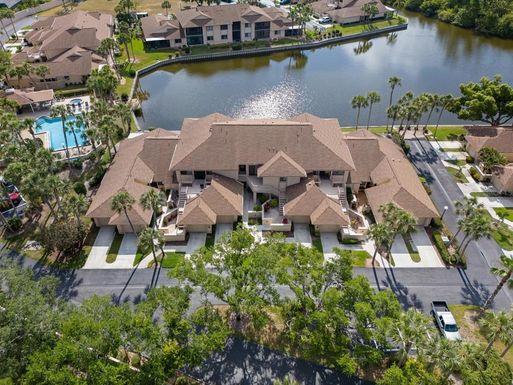
In May 2024, 34293, FL homes were selling for an average price of $512,354, 34293, FL homes on average sell after 58 days on the market compared to 32 days last year. There were 1617 homes sold in 34293, FL for May 2024, compared to 1512 last year.
The average list price of 34293, FL, was $467,838 in May 2024, compared to $520,832 in May 2023.
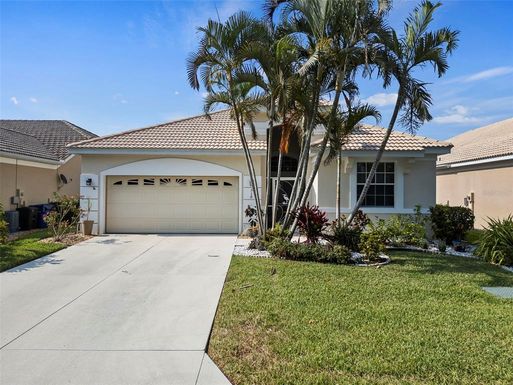
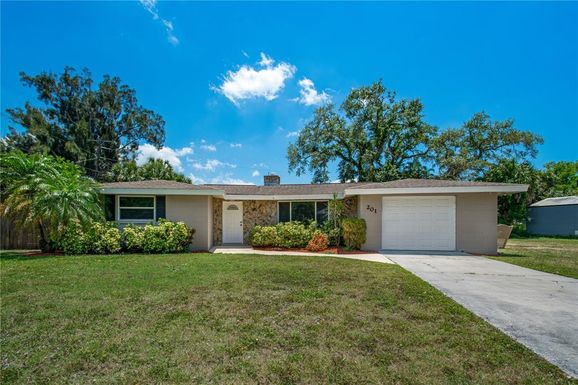
34293, FL Market Trend for Houses
Average List Price
The average list price of houses in 34293, FL, was $529,234 in May 2024, compared to $560,833 in May 2023.
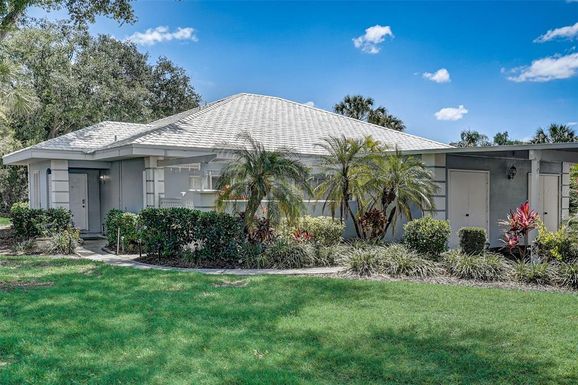
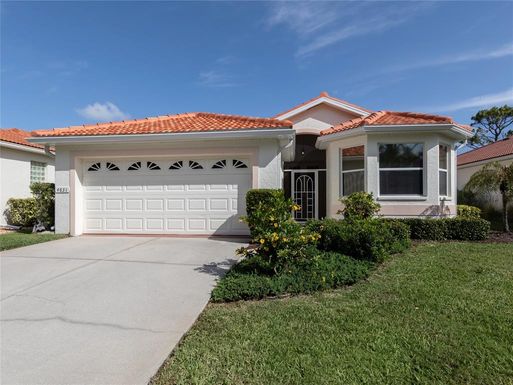
34293, FL Market Trend for Condos / Townhouses / Penthouses
Average List Price
The average list price of condos/co-ops in 34293, FL, was $343,520 in May 2024, compared to $384,771 in May 2023.
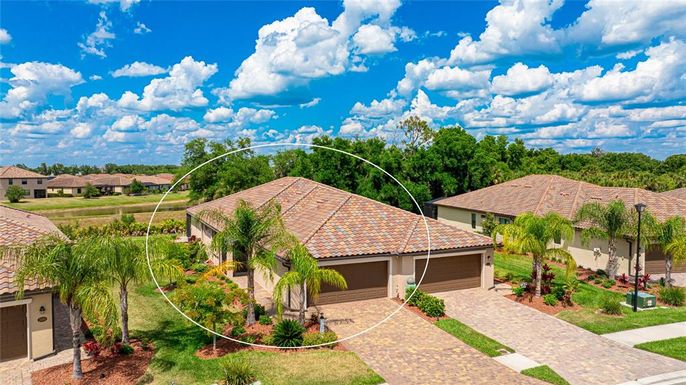
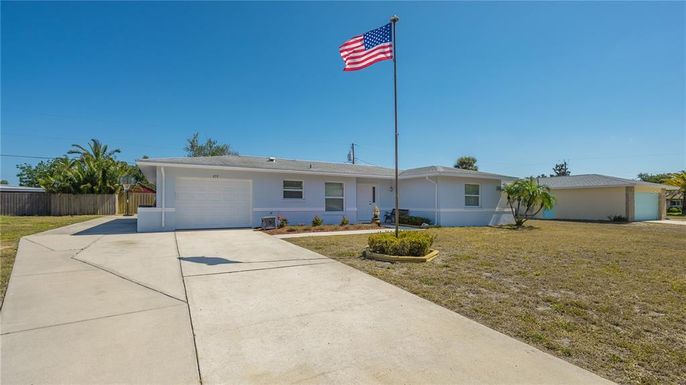
34293, FL Market Trend for Lots/Land
Average List Price
The average list price of lots/land in 34293, FL, was $260,602 in May 2024, compared to $179,643 in May 2023.
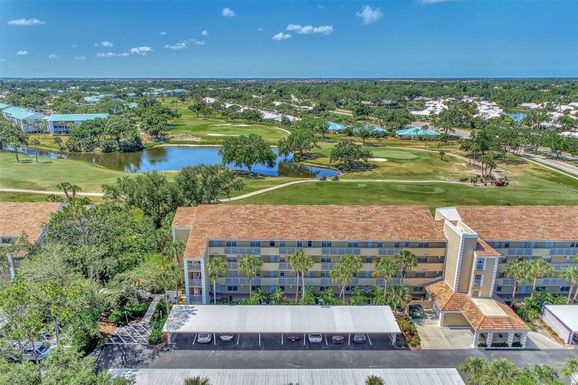
34293, FL Market Trend for Commercial
Average List Price
The average list price of commercial in 34293, FL, was $519,165 in May 2024, compared to $1,250,000 in May 2023.
34293, FL Housing Market Analysis
The average list price in 34293, FL is $467,838. The average list price in 34293, FL went down 9.85% from 2023 to 2024. 34293, FL home resale inventories is 377, which decreased 16.41% since 2023. The average list price per square foot in 34293, FL is $278. 2023 it was $288.