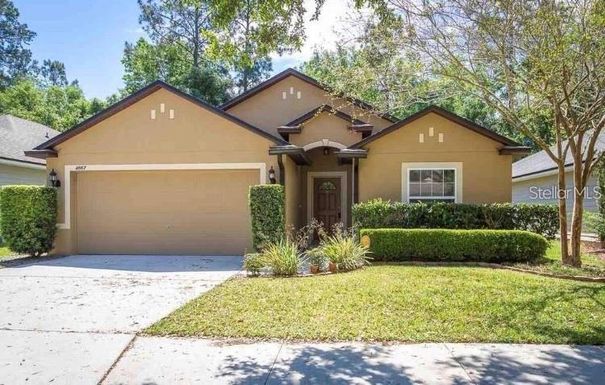
In May 2024, 32653, FL homes were selling for an average price of $377,467, 32653, FL homes on average sell after 42 days on the market compared to 34 days last year. There were 200 homes sold in 32653, FL for May 2024, compared to 222 last year.
The average list price of 32653, FL, was $523,263 in May 2024, compared to $396,720 in May 2023.
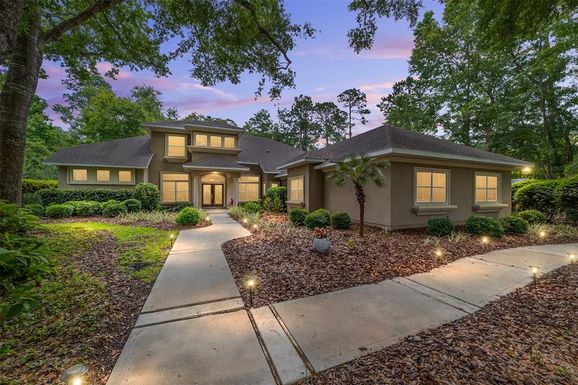
32653, FL Market Trend for Houses
Average List Price
The average list price of houses in 32653, FL, was $609,542 in May 2024, compared to $430,269 in May 2023.
32653, FL Market Trend for Condos / Townhouses / Penthouses
Average List Price
The average list price of condos/co-ops in 32653, FL, was $0 in May 2024, compared to $198,000 in May 2023.
32653, FL Market Trend for Lots/Land
Average List Price
The average list price of lots/land in 32653, FL, was $315,606 in May 2024, compared to $295,600 in May 2023.
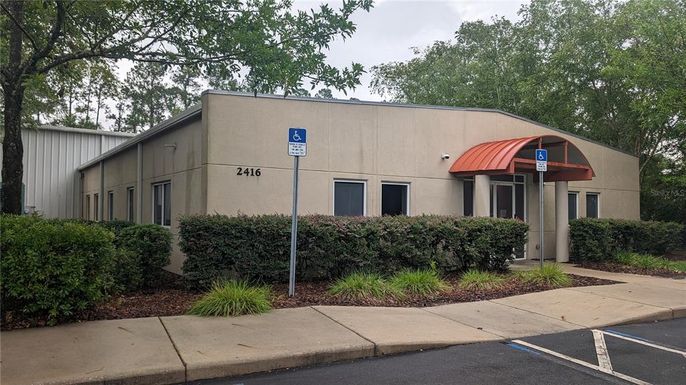
32653, FL Market Trend for Commercial
Average List Price
The average list price of commercial in 32653, FL, was $425,533 in May 2024, compared to $469,571 in May 2023.
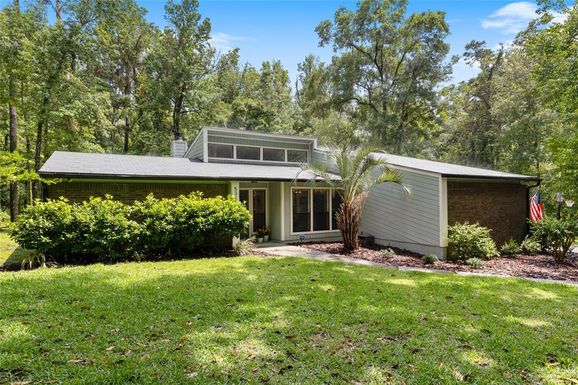
32653, FL Housing Market Analysis
The average list price in 32653, FL is $523,263. The average list price in 32653, FL went up 37.91% from 2023 to 2024. 32653, FL home resale inventories is 73, which increased 48.98% since 2023. The average list price per square foot in 32653, FL is $216. 2023 it was $187.