In May 2024, Micanopy, FL homes were selling for an average price of $521,300, Micanopy, FL homes on average sell after 89 days on the market compared to 79 days last year. There were 69 homes sold in Micanopy, FL for May 2024, compared to 62 last year.
The average list price of Micanopy, FL, was $2,265,347 in May 2024, compared to $1,404,982 in May 2023.
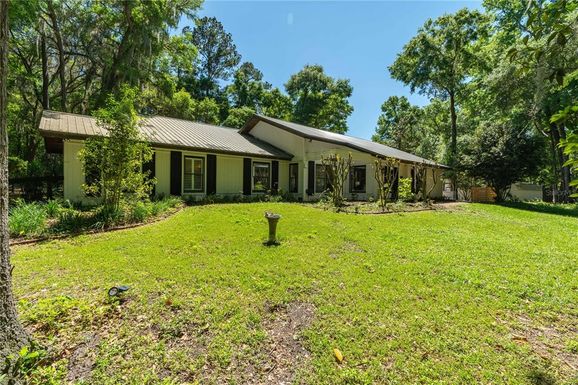
Micanopy, FL Market Trend for Houses
Average List Price
The average list price of houses in Micanopy, FL, was $3,395,292 in May 2024, compared to $551,088 in May 2023.
Micanopy, FL Market Trend for Condos / Townhouses / Penthouses
Average List Price
The average list price of condos/co-ops in Micanopy, FL, was $0 in May 2024, compared to $0 in May 2023.
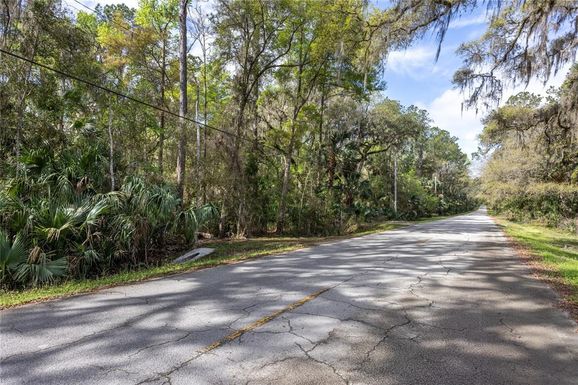
Micanopy, FL Market Trend for Lots/Land
Average List Price
The average list price of lots/land in Micanopy, FL, was $417,353 in May 2024, compared to $168,465 in May 2023.
Micanopy, FL Market Trend for Commercial
Average List Price
The average list price of commercial in Micanopy, FL, was $387,880 in May 2024, compared to $288,225 in May 2023.
Micanopy, FL Housing Market Analysis
The average list price in Micanopy, FL is $2,265,347. The average list price in Micanopy, FL went up 57.45% from 2023 to 2024. Micanopy, FL home resale inventories is 37, which increased 42.31% since 2023. The average list price per square foot in Micanopy, FL is $738. 2023 it was $641.