In May 2024, Gilchrist County homes were selling for an average price of $228,004, Gilchrist County homes on average sell after 72 days on the market compared to 72 days last year. There were 275 homes sold in Gilchrist County for May 2024, compared to 268 last year.
The average list price of Gilchrist County, was $335,584 in May 2024, compared to $323,816 in May 2023.
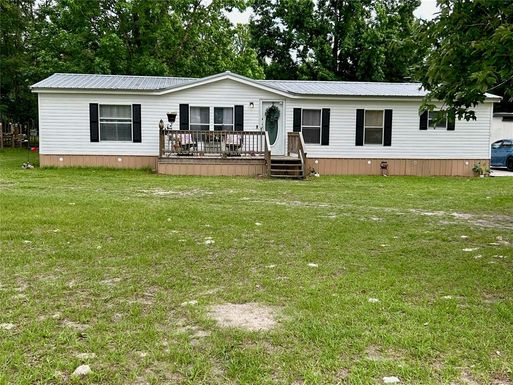
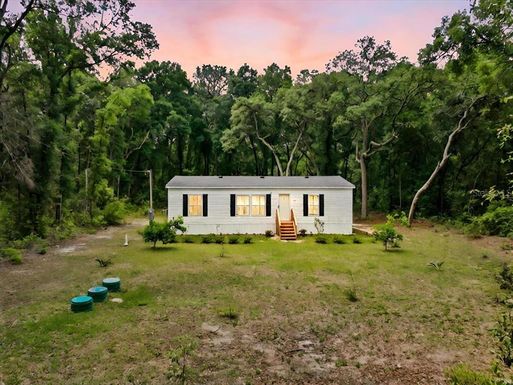
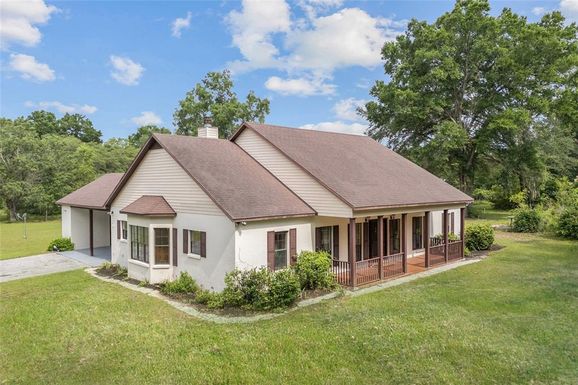
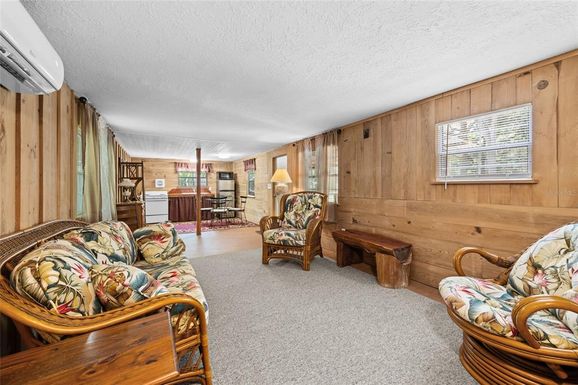
Gilchrist County Market Trend for Houses
Average List Price
The average list price of houses in Gilchrist County, was $442,021 in May 2024, compared to $383,665 in May 2023.
Gilchrist County Market Trend for Condos / Townhouses / Penthouses
Average List Price
The average list price of condos/co-ops in Gilchrist County, was $0 in May 2024, compared to $0 in May 2023.
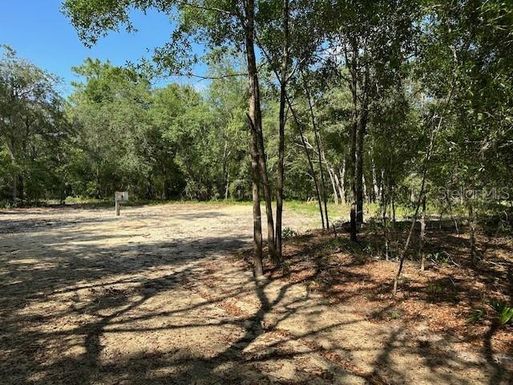
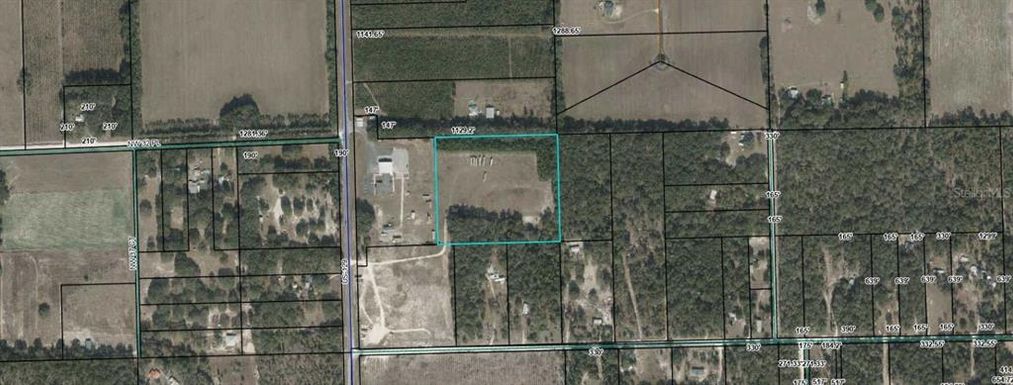
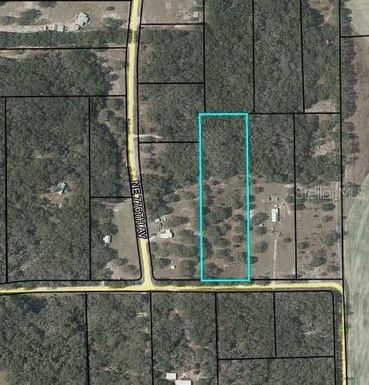
Gilchrist County Market Trend for Lots/Land
Average List Price
The average list price of lots/land in Gilchrist County, was $152,880 in May 2024, compared to $108,782 in May 2023.
Gilchrist County Market Trend for Commercial
Average List Price
The average list price of commercial in Gilchrist County, was $992,230 in May 2024, compared to $1,323,580 in May 2023.
Gilchrist County Housing Market Analysis
The average list price in Gilchrist County is $335,584. The average list price in Gilchrist County went down 3.83% from 2023 to 2024. Gilchrist County home resale inventories is 128, which increased 40.66% since 2023. The average list price per square foot in Gilchrist County is $267. 2023 it was $231.