In May 2024, 32609, FL homes were selling for an average price of $232,067, 32609, FL homes on average sell after 51 days on the market compared to 45 days last year. There were 195 homes sold in 32609, FL for May 2024, compared to 197 last year.
The average list price of 32609, FL, was $435,882 in May 2024, compared to $390,982 in May 2023.
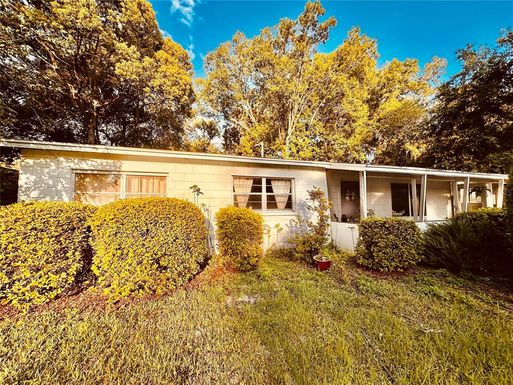
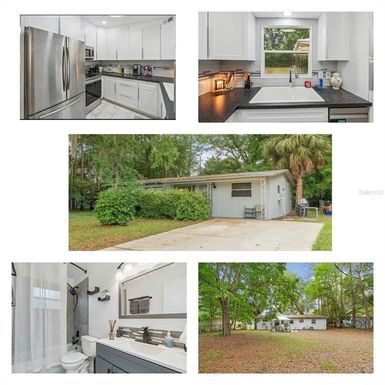
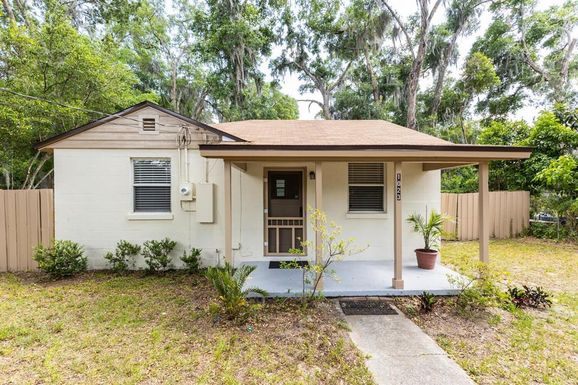
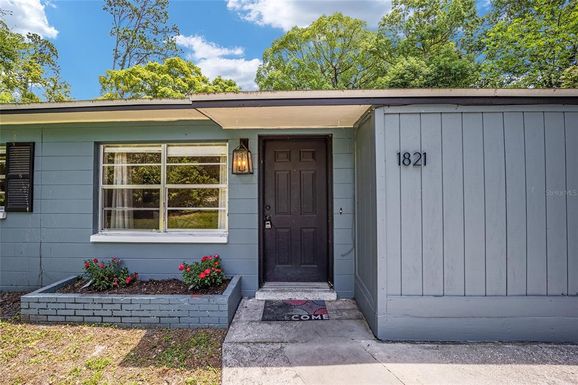
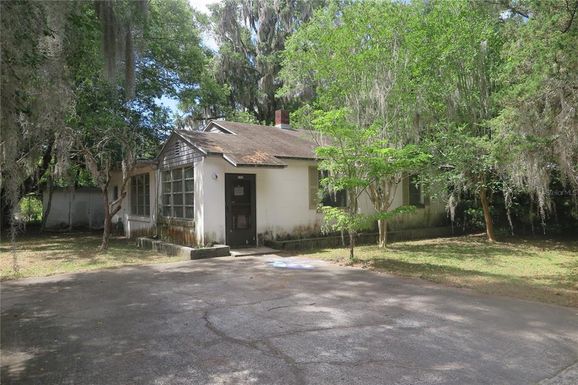
32609, FL Market Trend for Houses
Average List Price
The average list price of houses in 32609, FL, was $305,671 in May 2024, compared to $256,597 in May 2023.
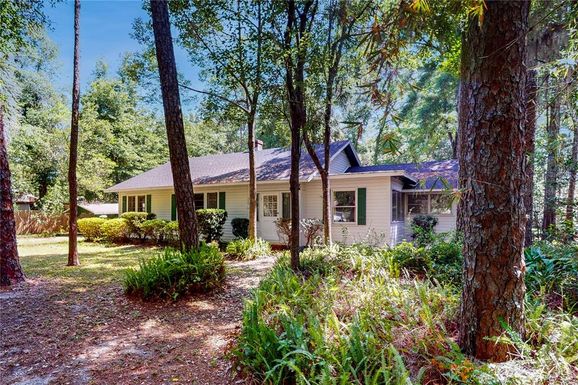
32609, FL Market Trend for Condos / Townhouses / Penthouses
Average List Price
The average list price of condos/co-ops in 32609, FL, was $224,950 in May 2024, compared to $199,500 in May 2023.
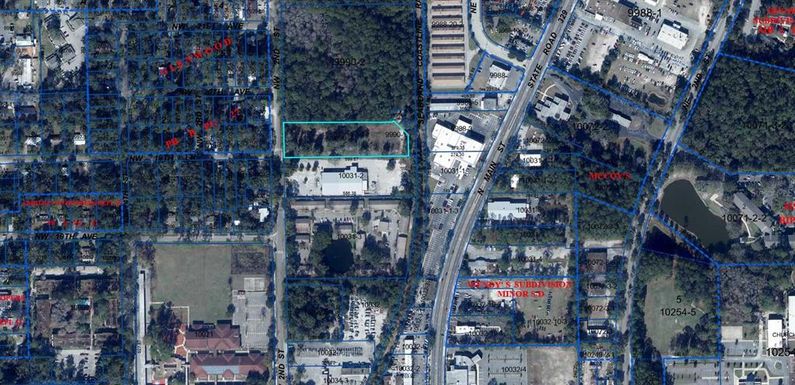
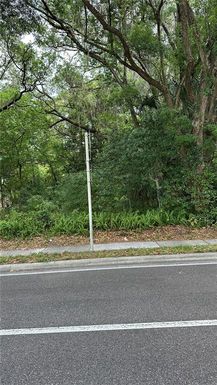
32609, FL Market Trend for Lots/Land
Average List Price
The average list price of lots/land in 32609, FL, was $650,992 in May 2024, compared to $641,064 in May 2023.
32609, FL Market Trend for Commercial
Average List Price
The average list price of commercial in 32609, FL, was $1,041,268 in May 2024, compared to $887,360 in May 2023.
32609, FL Housing Market Analysis
The average list price in 32609, FL is $435,882. The average list price in 32609, FL went up 9.13% from 2023 to 2024. 32609, FL home resale inventories is 74, which increased 4.23% since 2023. The average list price per square foot in 32609, FL is $154. 2023 it was $180.