In May 2024, 32605, FL homes were selling for an average price of $337,340, 32605, FL homes on average sell after 34 days on the market compared to 29 days last year. There were 40 homes sold in 32605, FL for May 2024, compared to 10 last year.
The average list price of 32605, FL, was $348,913 in May 2024, compared to $188,735 in May 2023.
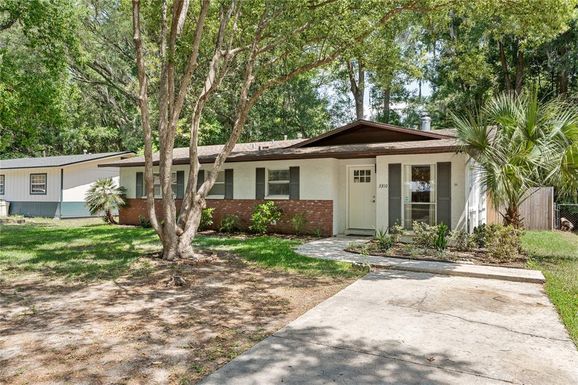
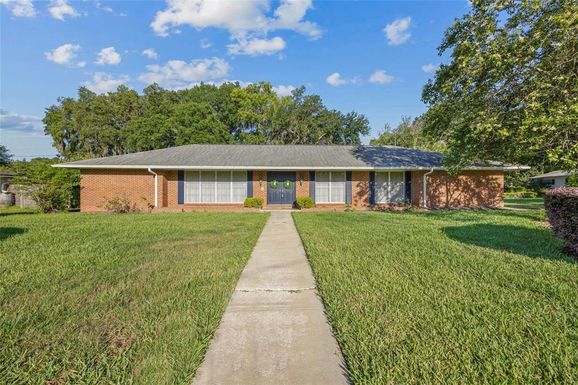
32605, FL Market Trend for Houses
Average List Price
The average list price of houses in 32605, FL, was $430,480 in May 2024, compared to $259,900 in May 2023.
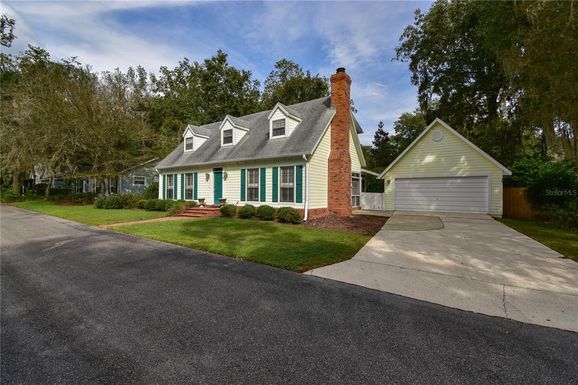
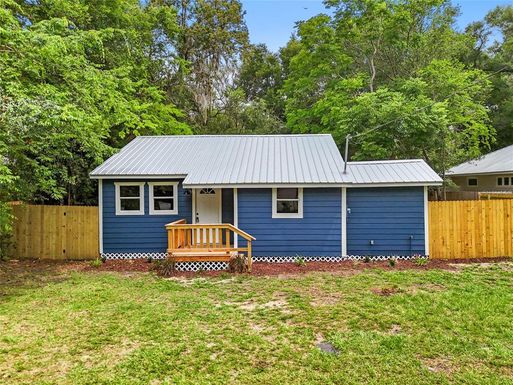
32605, FL Market Trend for Condos / Townhouses / Penthouses
Average List Price
The average list price of condos/co-ops in 32605, FL, was $211,420 in May 2024, compared to $235,000 in May 2023.
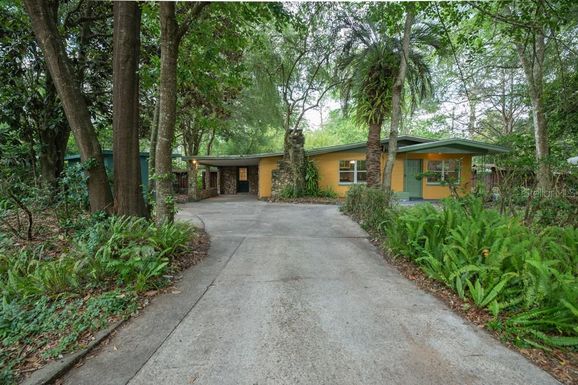
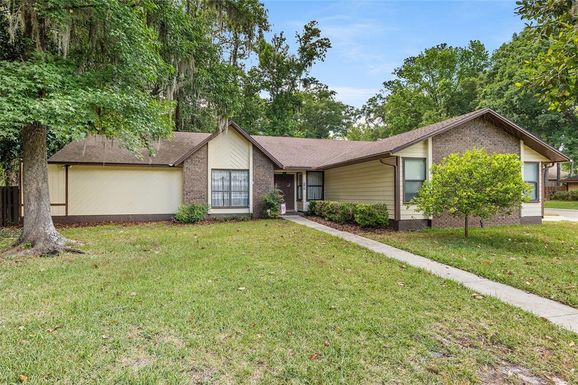
32605, FL Market Trend for Lots/Land
Average List Price
The average list price of lots/land in 32605, FL, was $157,450 in May 2024, compared to $0 in May 2023.
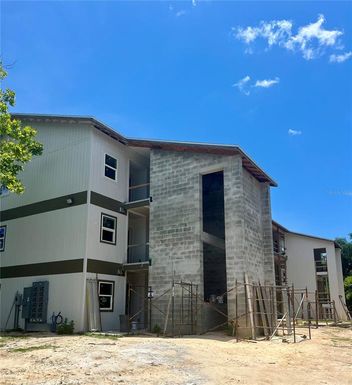
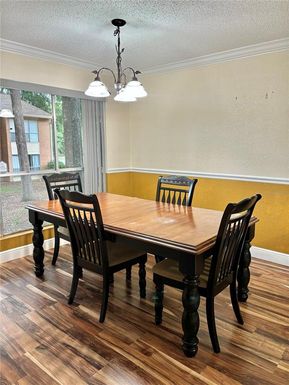
32605, FL Market Trend for Commercial
Average List Price
The average list price of commercial in 32605, FL, was $56,780 in May 2024, compared to $25,039 in May 2023.
32605, FL Housing Market Analysis
The average list price in 32605, FL is $348,913. The average list price in 32605, FL went up 84.87% from 2023 to 2024. 32605, FL home resale inventories is 72, which increased 1700.00% since 2023. The average list price per square foot in 32605, FL is $189. 2023 it was $102.