In May 2024, Osteen, FL homes were selling for an average price of $395,375, Osteen, FL homes on average sell after 57 days on the market compared to 48 days last year. There were 99 homes sold in Osteen, FL for May 2024, compared to 80 last year.
The average list price of Osteen, FL, was $396,754 in May 2024, compared to $429,772 in May 2023.
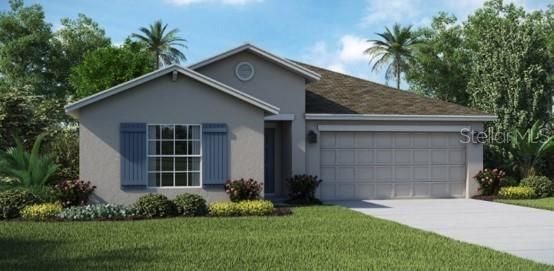
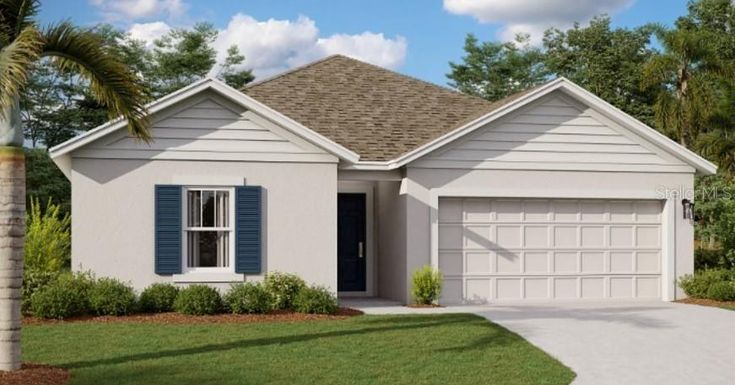
Osteen, FL Market Trend for Houses
Average List Price
The average list price of houses in Osteen, FL, was $560,519 in May 2024, compared to $587,100 in May 2023.
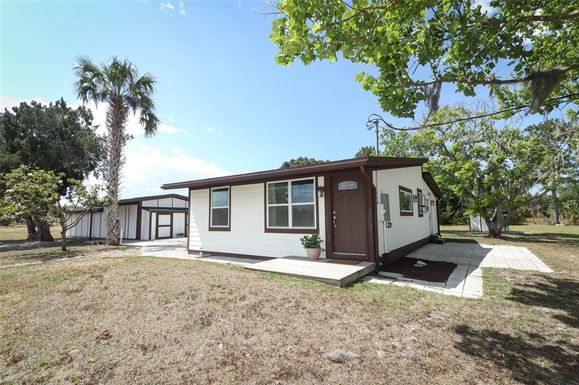
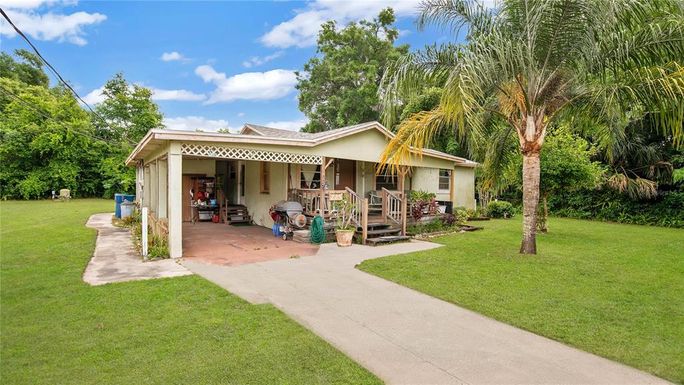
Osteen, FL Market Trend for Condos / Townhouses / Penthouses
Average List Price
The average list price of condos/co-ops in Osteen, FL, was $0 in May 2024, compared to $0 in May 2023.
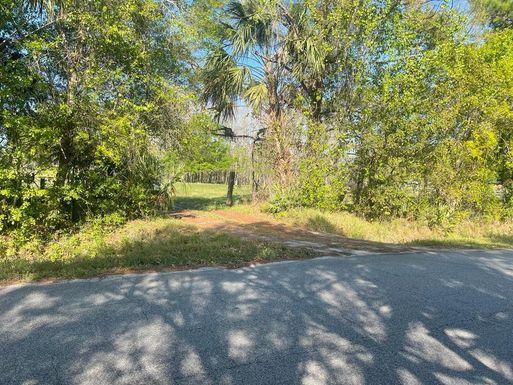
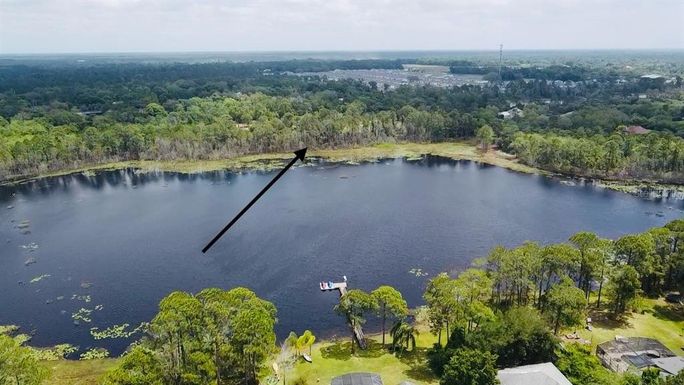
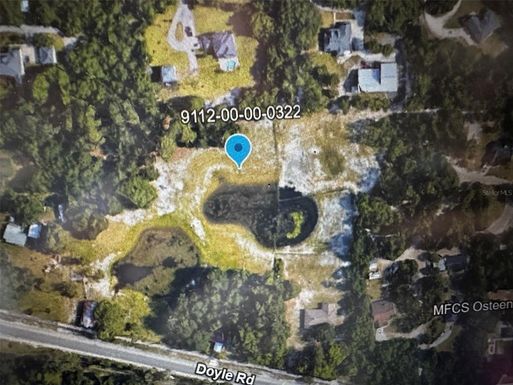
Osteen, FL Market Trend for Lots/Land
Average List Price
The average list price of lots/land in Osteen, FL, was $312,783 in May 2024, compared to $267,536 in May 2023.
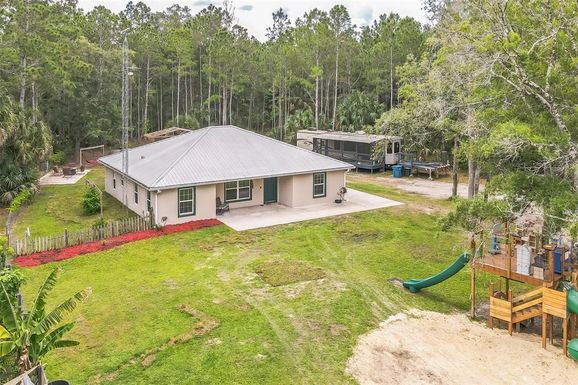
Osteen, FL Market Trend for Commercial
Average List Price
The average list price of commercial in Osteen, FL, was $594,000 in May 2024, compared to $0 in May 2023.
Osteen, FL Housing Market Analysis
The average list price in Osteen, FL is $396,754. The average list price in Osteen, FL went down 15.45% from 2023 to 2024. Osteen, FL home resale inventories is 35, which increased 59.09% since 2023. The average list price per square foot in Osteen, FL is $246. 2023 it was $295.