In May 2024, Orange County homes were selling for an average price of $482,477, Orange County homes on average sell after 41 days on the market compared to 33 days last year. There were 10042 homes sold in Orange County for May 2024, compared to 10652 last year.
The average list price of Orange County, was $624,228 in May 2024, compared to $564,559 in May 2023.
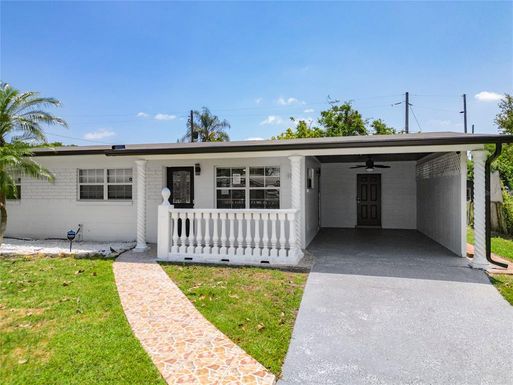
Orange County Market Trend for Houses
Average List Price
The average list price of houses in Orange County, was $797,840 in May 2024, compared to $641,692 in May 2023.
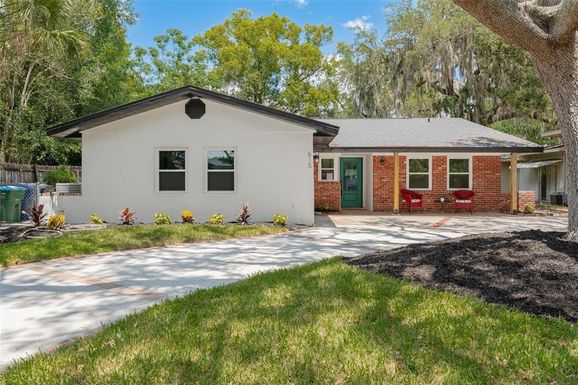
Orange County Market Trend for Condos / Townhouses / Penthouses
Average List Price
The average list price of condos/co-ops in Orange County, was $330,382 in May 2024, compared to $336,672 in May 2023.
Orange County Market Trend for Lots/Land
Average List Price
The average list price of lots/land in Orange County, was $963,774 in May 2024, compared to $848,123 in May 2023.
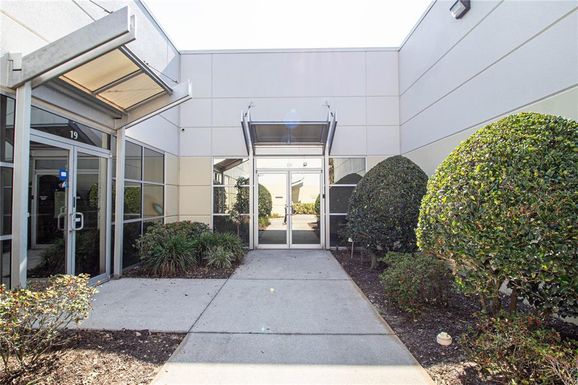
Orange County Market Trend for Commercial
Average List Price
The average list price of commercial in Orange County, was $1,263,163 in May 2024, compared to $1,288,528 in May 2023.
Orange County Housing Market Analysis
The average list price in Orange County is $624,228. The average list price in Orange County went up 8.67% from 2023 to 2024. Orange County home resale inventories is 2786, which increased 23.82% since 2023. The average list price per square foot in Orange County is $287. 2023 it was $264.