In May 2024, 32738, FL homes were selling for an average price of $315,807, 32738, FL homes on average sell after 44 days on the market compared to 41 days last year. There were 776 homes sold in 32738, FL for May 2024, compared to 1044 last year.
The average list price of 32738, FL, was $342,127 in May 2024, compared to $340,040 in May 2023.
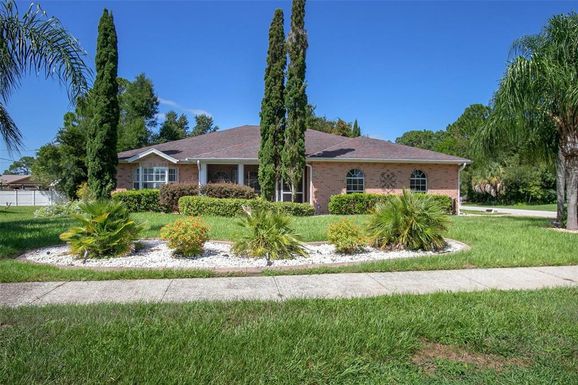
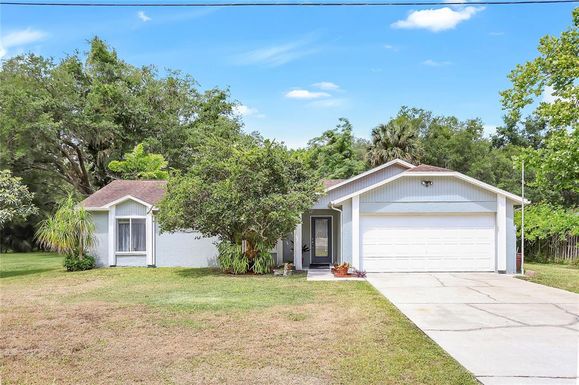
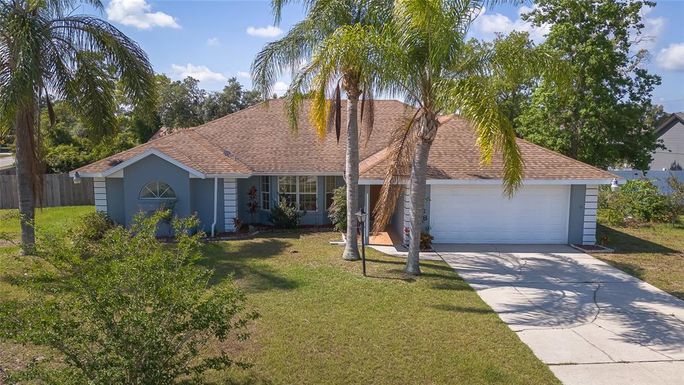
32738, FL Market Trend for Houses
Average List Price
The average list price of houses in 32738, FL, was $385,696 in May 2024, compared to $343,620 in May 2023.
32738, FL Market Trend for Condos / Townhouses / Penthouses
Average List Price
The average list price of condos/co-ops in 32738, FL, was $0 in May 2024, compared to $0 in May 2023.
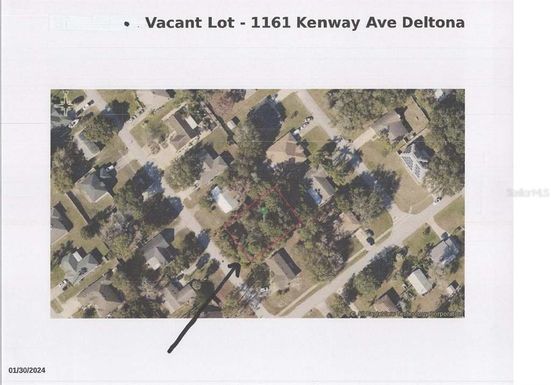
32738, FL Market Trend for Lots/Land
Average List Price
The average list price of lots/land in 32738, FL, was $261,503 in May 2024, compared to $341,067 in May 2023.
32738, FL Market Trend for Commercial
Average List Price
The average list price of commercial in 32738, FL, was $176,950 in May 2024, compared to $221,967 in May 2023.
32738, FL Housing Market Analysis
The average list price in 32738, FL is $342,127. The average list price in 32738, FL went up 1.99% from 2023 to 2024. 32738, FL home resale inventories is 213, which decreased 5.33% since 2023. The average list price per square foot in 32738, FL is $222. 2023 it was $204.