In May 2024, Sanford, FL homes were selling for an average price of $410,284, Sanford, FL homes on average sell after 50 days on the market compared to 49 days last year. There were 1474 homes sold in Sanford, FL for May 2024, compared to 1548 last year.
The average list price of Sanford, FL, was $533,186 in May 2024, compared to $484,026 in May 2023.
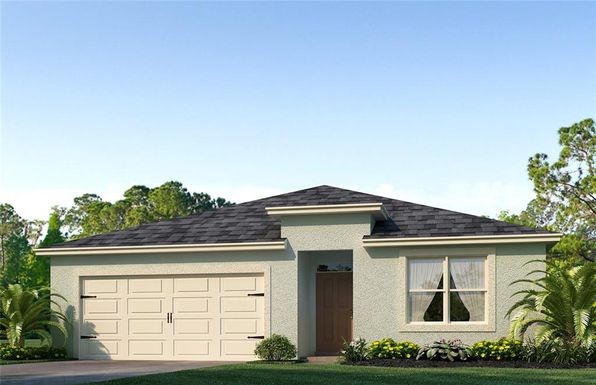
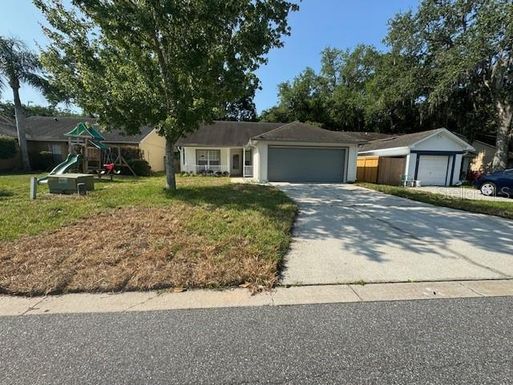
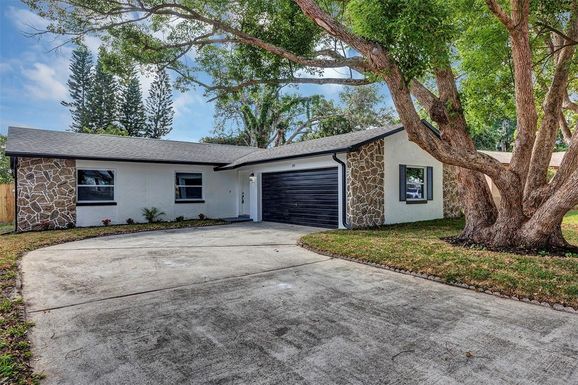
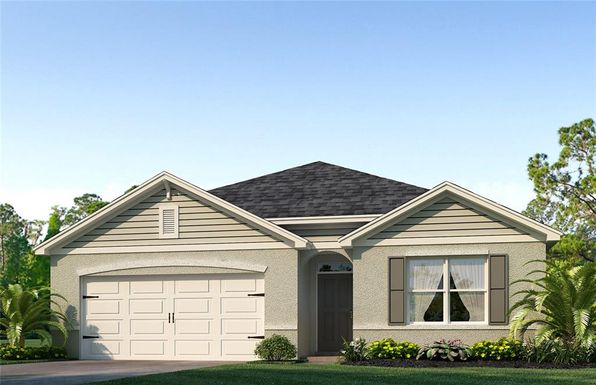
Sanford, FL Market Trend for Houses
Average List Price
The average list price of houses in Sanford, FL, was $520,221 in May 2024, compared to $486,370 in May 2023.
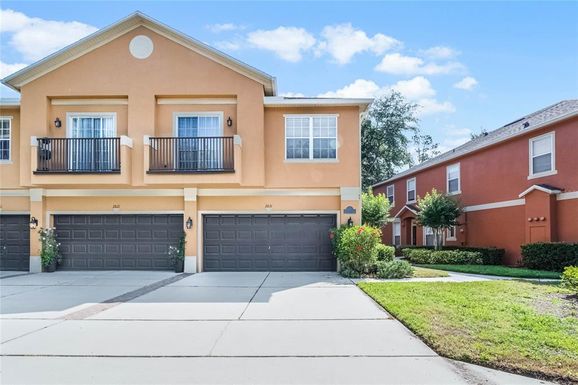
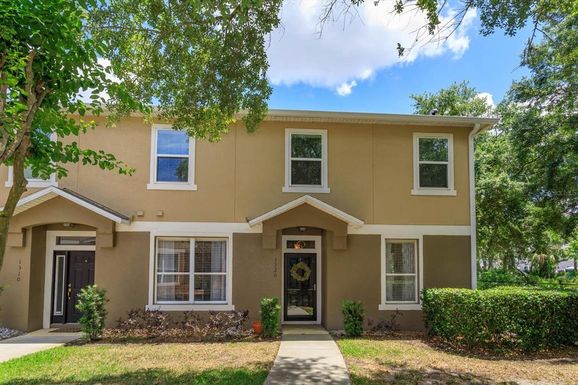
Sanford, FL Market Trend for Condos / Townhouses / Penthouses
Average List Price
The average list price of condos/co-ops in Sanford, FL, was $306,031 in May 2024, compared to $314,157 in May 2023.
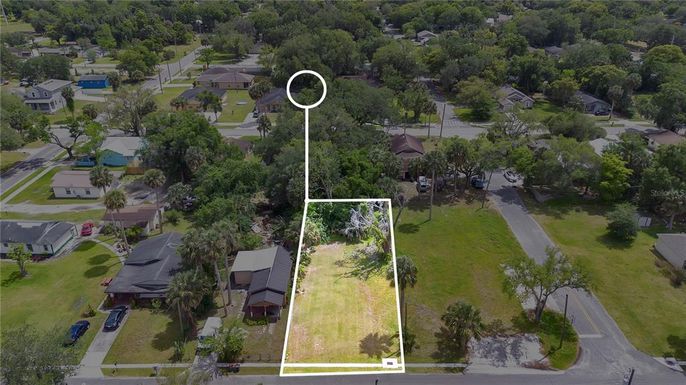
Sanford, FL Market Trend for Lots/Land
Average List Price
The average list price of lots/land in Sanford, FL, was $463,856 in May 2024, compared to $341,193 in May 2023.
Sanford, FL Market Trend for Commercial
Average List Price
The average list price of commercial in Sanford, FL, was $1,380,556 in May 2024, compared to $1,691,817 in May 2023.
Sanford, FL Housing Market Analysis
The average list price in Sanford, FL is $533,186. The average list price in Sanford, FL went up 11.10% from 2023 to 2024. Sanford, FL home resale inventories is 374, which increased 10.98% since 2023. The average list price per square foot in Sanford, FL is $256. 2023 it was $228.