In May 2024, Ocala, FL homes were selling for an average price of $288,533, Ocala, FL homes on average sell after 73 days on the market compared to 53 days last year. There were 9088 homes sold in Ocala, FL for May 2024, compared to 8002 last year.
The average list price of Ocala, FL, was $387,503 in May 2024, compared to $366,010 in May 2023.
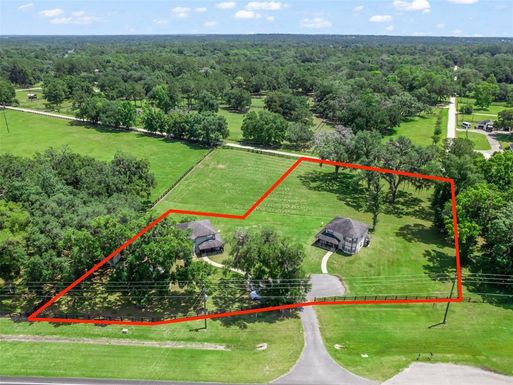
Ocala, FL Market Trend for Houses
Average List Price
The average list price of houses in Ocala, FL, was $378,511 in May 2024, compared to $336,146 in May 2023.
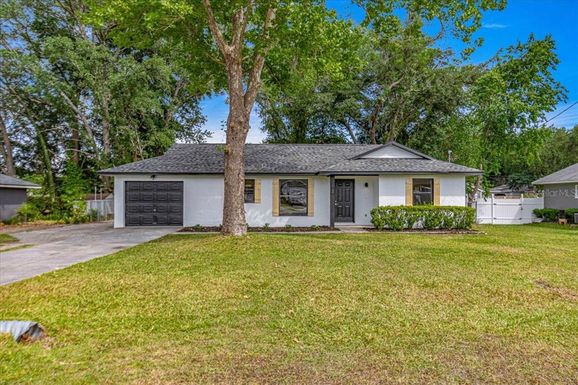
Ocala, FL Market Trend for Condos / Townhouses / Penthouses
Average List Price
The average list price of condos/co-ops in Ocala, FL, was $225,712 in May 2024, compared to $217,801 in May 2023.
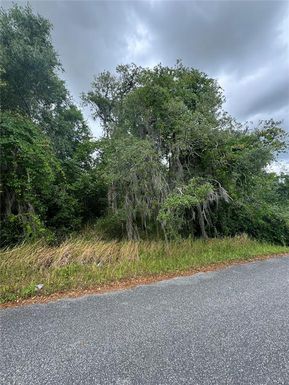
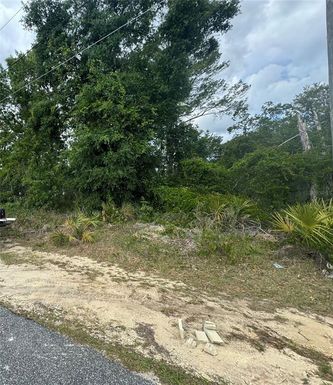
Ocala, FL Market Trend for Lots/Land
Average List Price
The average list price of lots/land in Ocala, FL, was $320,824 in May 2024, compared to $222,455 in May 2023.
Ocala, FL Market Trend for Commercial
Average List Price
The average list price of commercial in Ocala, FL, was $561,738 in May 2024, compared to $517,103 in May 2023.
Ocala, FL Housing Market Analysis
The average list price in Ocala, FL is $387,503. The average list price in Ocala, FL went up 5.42% from 2023 to 2024. Ocala, FL home resale inventories is 3254, which increased 11.40% since 2023. The average list price per square foot in Ocala, FL is $208. 2023 it was $186.