In May 2024, Lecanto, FL homes were selling for an average price of $285,302, Lecanto, FL homes on average sell after 77 days on the market compared to 66 days last year. There were 95 homes sold in Lecanto, FL for May 2024, compared to 86 last year.
The average list price of Lecanto, FL, was $511,488 in May 2024, compared to $348,862 in May 2023.
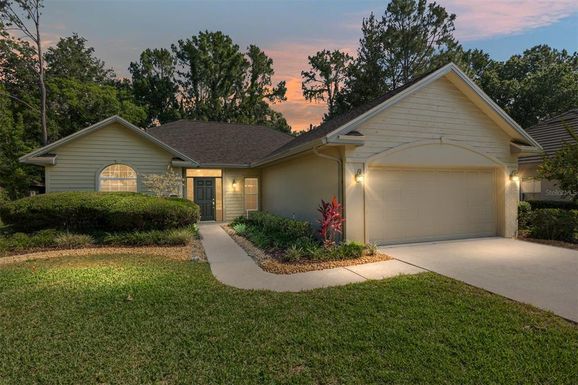
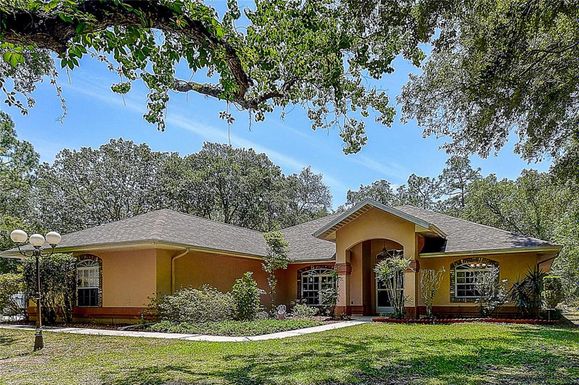
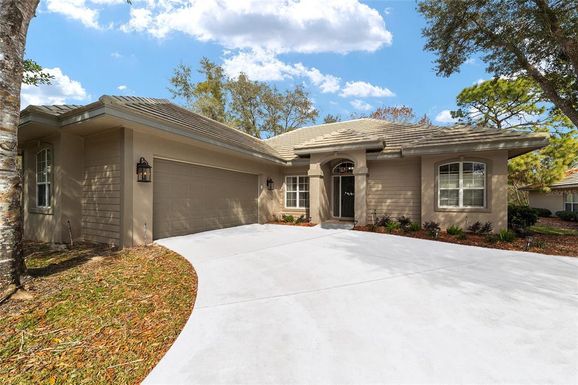
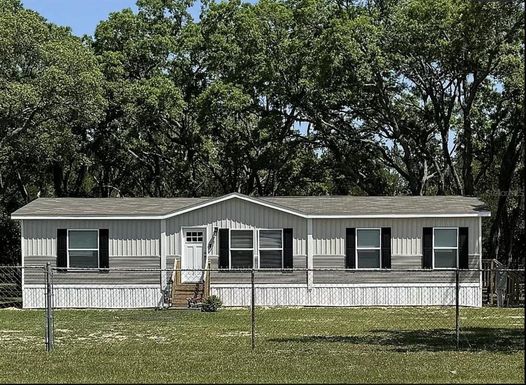
Lecanto, FL Market Trend for Houses
Average List Price
The average list price of houses in Lecanto, FL, was $612,840 in May 2024, compared to $395,513 in May 2023.
Lecanto, FL Market Trend for Condos / Townhouses / Penthouses
Average List Price
The average list price of condos/co-ops in Lecanto, FL, was $225,000 in May 2024, compared to $230,000 in May 2023.
Lecanto, FL Market Trend for Lots/Land
Average List Price
The average list price of lots/land in Lecanto, FL, was $285,905 in May 2024, compared to $290,110 in May 2023.
Lecanto, FL Market Trend for Commercial
Average List Price
The average list price of commercial in Lecanto, FL, was $697,500 in May 2024, compared to $562,450 in May 2023.
Lecanto, FL Housing Market Analysis
The average list price in Lecanto, FL is $511,488. The average list price in Lecanto, FL went up 45.92% from 2023 to 2024. Lecanto, FL home resale inventories is 58, which increased 107.14% since 2023. The average list price per square foot in Lecanto, FL is $245. 2023 it was $182.