In May 2024, Inverness, FL homes were selling for an average price of $231,481, Inverness, FL homes on average sell after 79 days on the market compared to 48 days last year. There were 388 homes sold in Inverness, FL for May 2024, compared to 396 last year.
The average list price of Inverness, FL, was $197,140 in May 2024, compared to $182,687 in May 2023.
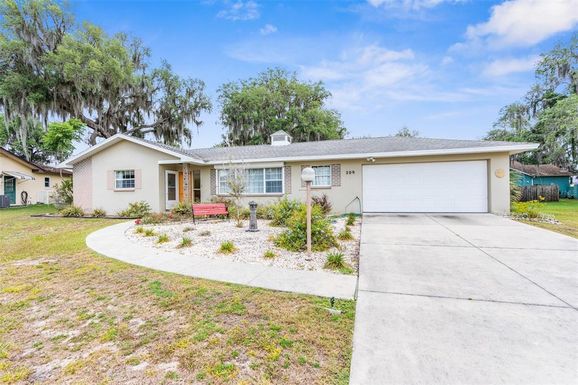
Inverness, FL Market Trend for Houses
Average List Price
The average list price of houses in Inverness, FL, was $331,173 in May 2024, compared to $324,302 in May 2023.
Inverness, FL Market Trend for Condos / Townhouses / Penthouses
Average List Price
The average list price of condos/co-ops in Inverness, FL, was $222,663 in May 2024, compared to $187,500 in May 2023.
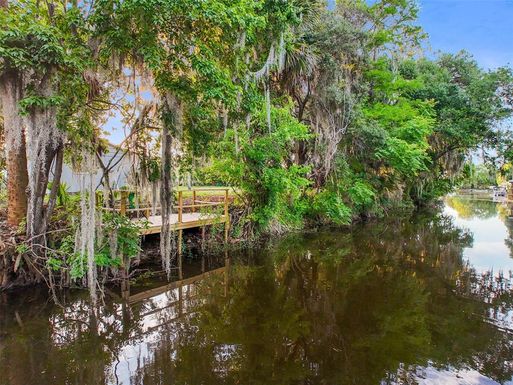
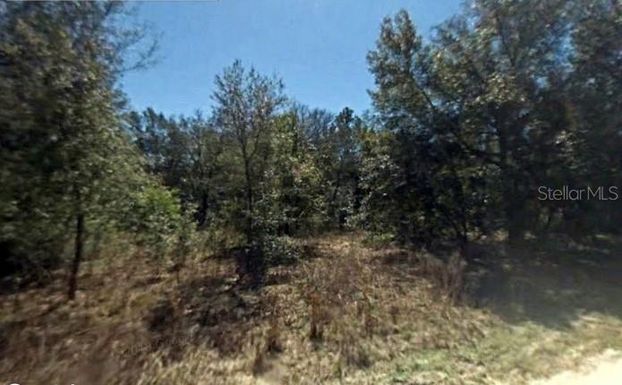
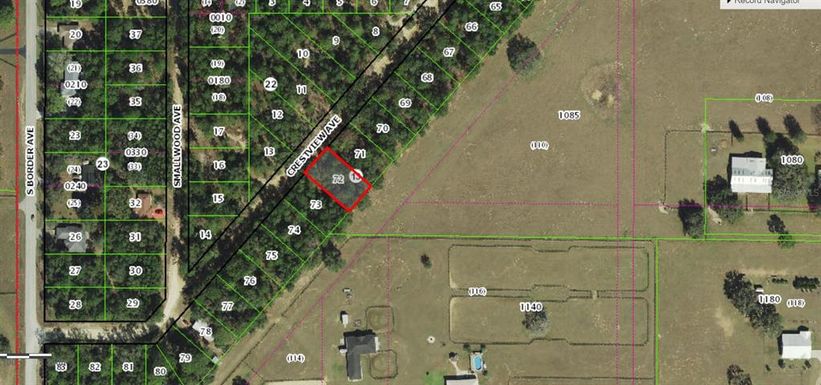
Inverness, FL Market Trend for Lots/Land
Average List Price
The average list price of lots/land in Inverness, FL, was $50,028 in May 2024, compared to $87,118 in May 2023.
Inverness, FL Market Trend for Commercial
Average List Price
The average list price of commercial in Inverness, FL, was $291,378 in May 2024, compared to $65,013 in May 2023.
Inverness, FL Housing Market Analysis
The average list price in Inverness, FL is $197,140. The average list price in Inverness, FL went up 2.40% from 2023 to 2024. Inverness, FL home resale inventories is 266, which increased 97.04% since 2023. The average list price per square foot in Inverness, FL is $200. 2023 it was $189.