In May 2024, Coleman, FL homes were selling for an average price of $206,917, Coleman, FL homes on average sell after 137 days on the market compared to 120 days last year. There were 17 homes sold in Coleman, FL for May 2024, compared to 10 last year.
The average list price of Coleman, FL, was $1,323,525 in May 2024, compared to $524,150 in May 2023.
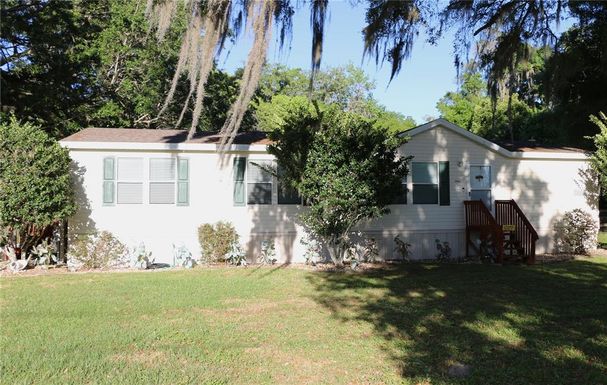
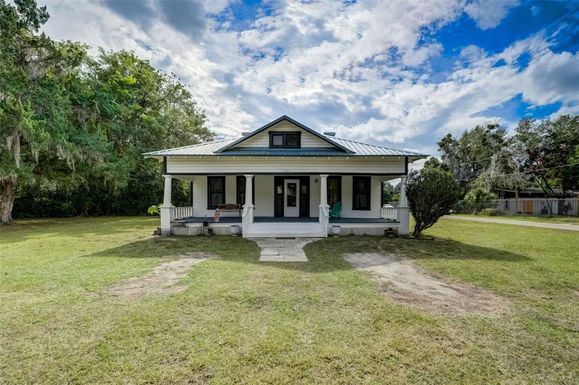
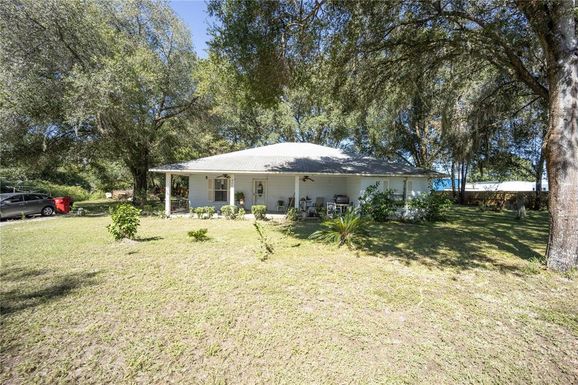
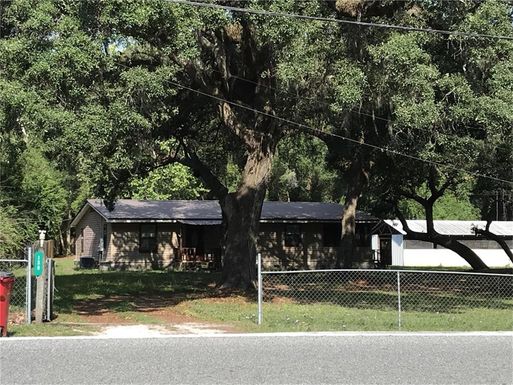
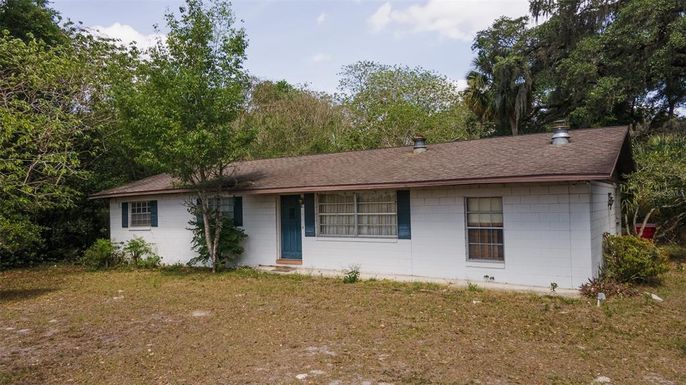
Coleman, FL Market Trend for Houses
Average List Price
The average list price of houses in Coleman, FL, was $314,667 in May 2024, compared to $227,825 in May 2023.
Coleman, FL Market Trend for Condos / Townhouses / Penthouses
Average List Price
The average list price of condos/co-ops in Coleman, FL, was $0 in May 2024, compared to $0 in May 2023.
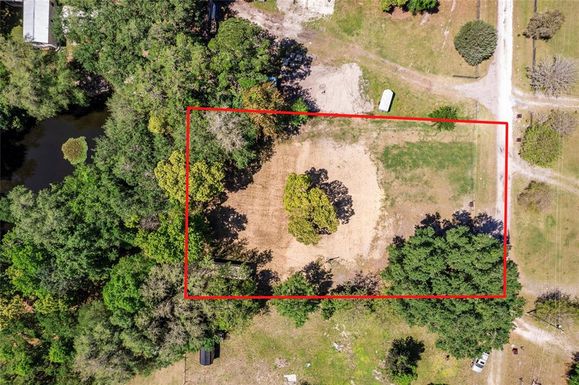
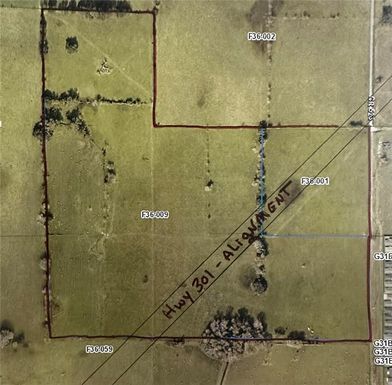
Coleman, FL Market Trend for Lots/Land
Average List Price
The average list price of lots/land in Coleman, FL, was $2,155,980 in May 2024, compared to $788,667 in May 2023.
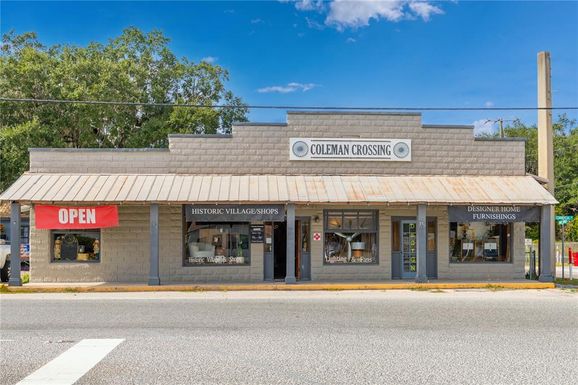
Coleman, FL Market Trend for Commercial
Average List Price
The average list price of commercial in Coleman, FL, was $1,292,833 in May 2024, compared to $323,250 in May 2023.
Coleman, FL Housing Market Analysis
The average list price in Coleman, FL is $1,323,525. The average list price in Coleman, FL went up 171.89% from 2023 to 2024. Coleman, FL home resale inventories is 12, which decreased 7.69% since 2023. The average list price per square foot in Coleman, FL is $302. 2023 it was $307.