In May 2024, 33993, FL homes were selling for an average price of $241,872, 33993, FL homes on average sell after 94 days on the market compared to 75 days last year. There were 322 homes sold in 33993, FL for May 2024, compared to 222 last year.
The average list price of 33993, FL, was $286,899 in May 2024, compared to $206,355 in May 2023.
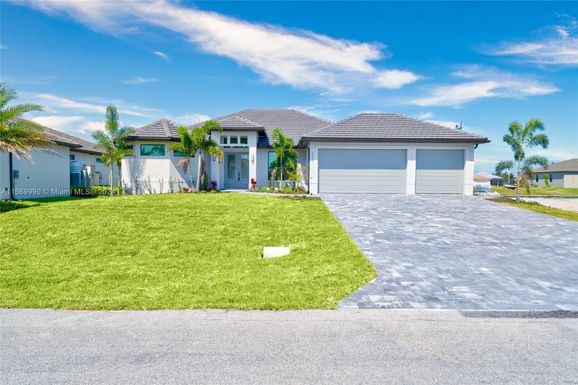
33993, FL Market Trend for Houses
Average List Price
The average list price of houses in 33993, FL, was $570,751 in May 2024, compared to $587,746 in May 2023.
33993, FL Market Trend for Condos / Townhouses / Penthouses
Average List Price
The average list price of condos/co-ops in 33993, FL, was $0 in May 2024, compared to $0 in May 2023.
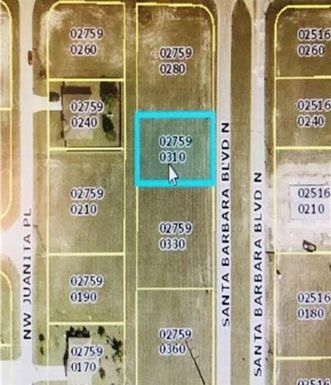
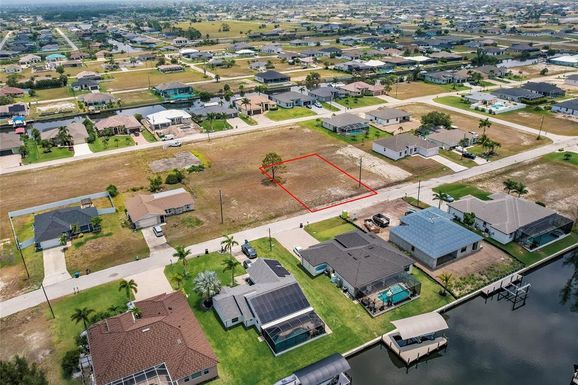
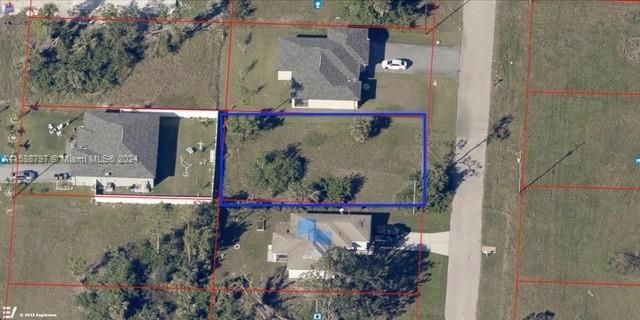
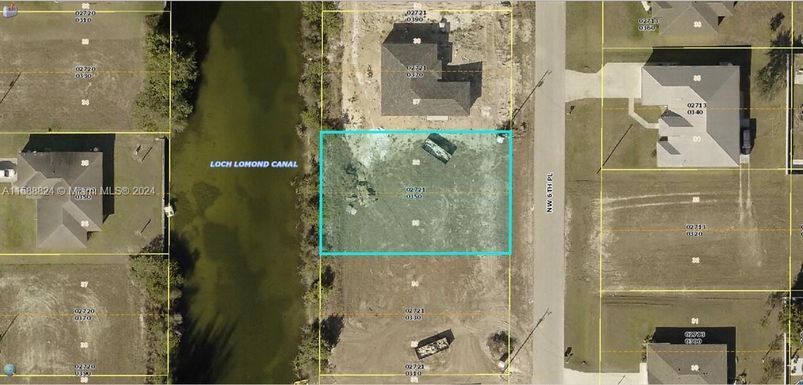
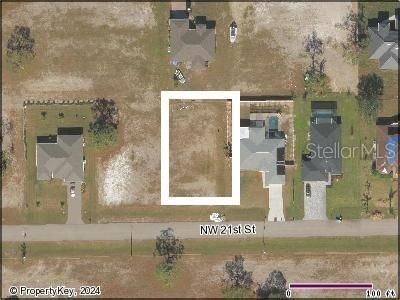
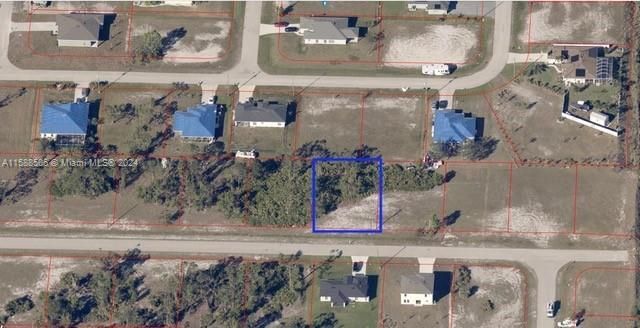
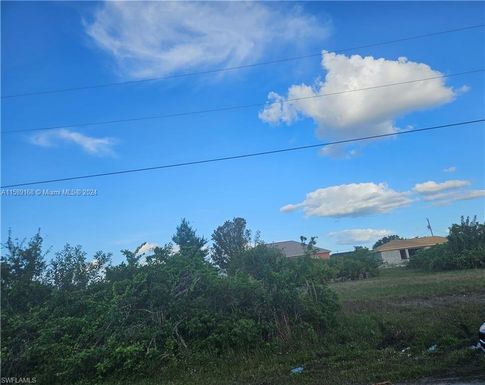
33993, FL Market Trend for Lots/Land
Average List Price
The average list price of lots/land in 33993, FL, was $100,432 in May 2024, compared to $71,575 in May 2023.
33993, FL Market Trend for Commercial
Average List Price
The average list price of commercial in 33993, FL, was $179,207 in May 2024, compared to $101,573 in May 2023.
33993, FL Housing Market Analysis
The average list price in 33993, FL is $286,899. The average list price in 33993, FL went up 27.82% from 2023 to 2024. 33993, FL home resale inventories is 362, which increased 187.30% since 2023. The average list price per square foot in 33993, FL is $282. 2023 it was $316.