In May 2024, 33909, FL homes were selling for an average price of $209,223, 33909, FL homes on average sell after 126 days on the market compared to 94 days last year. There were 73 homes sold in 33909, FL for May 2024, compared to 30 last year.
The average list price of 33909, FL, was $242,738 in May 2024, compared to $151,142 in May 2023.
33909, FL Market Trend for Houses
Average List Price
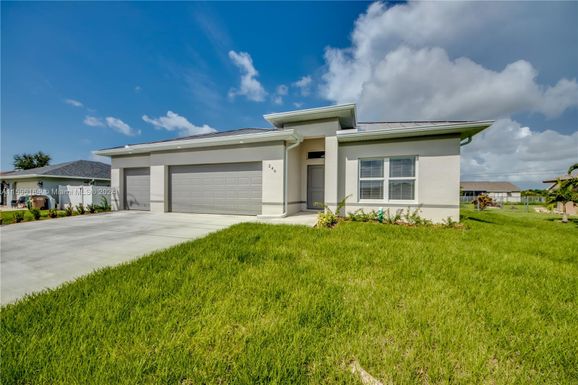
The average list price of houses in 33909, FL, was $435,149 in May 2024, compared to $433,088 in May 2023.
33909, FL Market Trend for Condos / Townhouses / Penthouses
Average List Price
The average list price of condos/co-ops in 33909, FL, was $255,833 in May 2024, compared to $0 in May 2023.
33909, FL Market Trend for Lots/Land
Average List Price
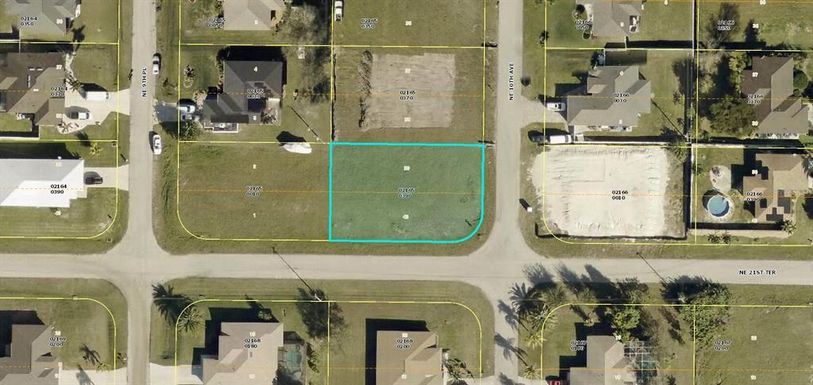
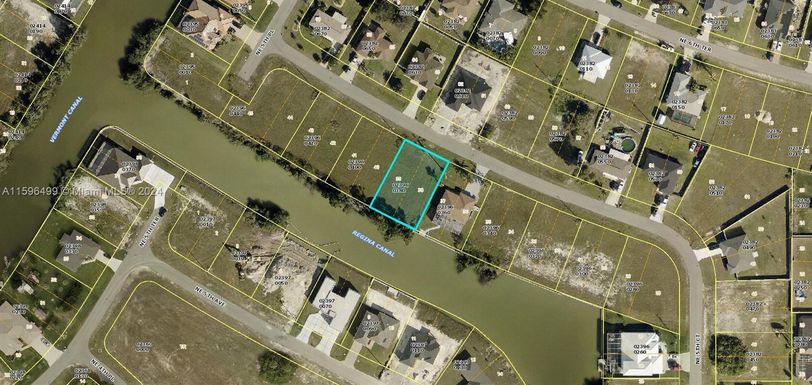
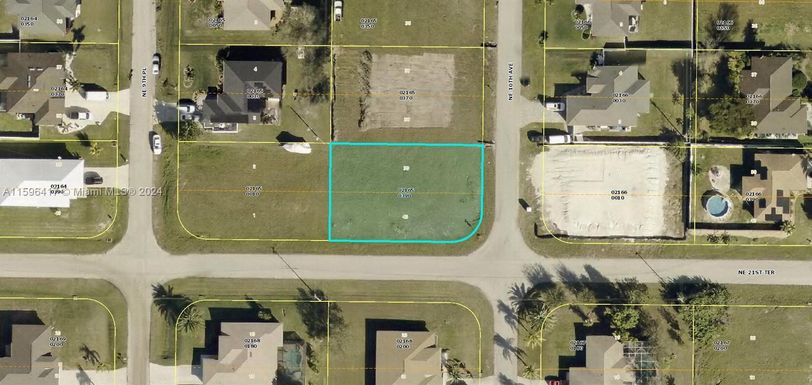
The average list price of lots/land in 33909, FL, was $67,042 in May 2024, compared to $61,038 in May 2023.
33909, FL Market Trend for Commercial
Average List Price
The average list price of commercial in 33909, FL, was $128,514 in May 2024, compared to $60,300 in May 2023.
33909, FL Housing Market Analysis
The average list price in 33909, FL is $242,738. The average list price in 33909, FL went up 60.60% from 2023 to 2024. 33909, FL home resale inventories is 123, which increased 272.73% since 2023. The average list price per square foot in 33909, FL is $239. 2023 it was $250.