In May 2024, 33903, FL homes were selling for an average price of $398,121, 33903, FL homes on average sell after 68 days on the market compared to 44 days last year. There were 33 homes sold in 33903, FL for May 2024, compared to 20 last year.
The average list price of 33903, FL, was $402,165 in May 2024, compared to $437,910 in May 2023.
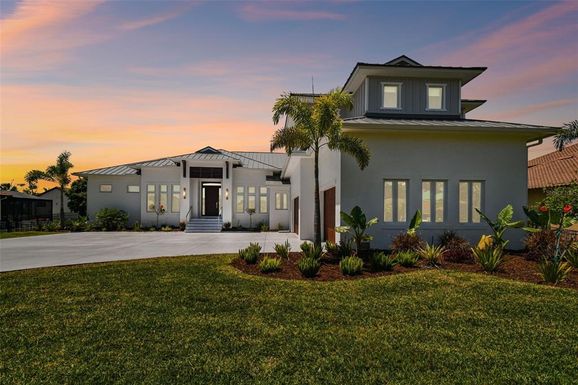
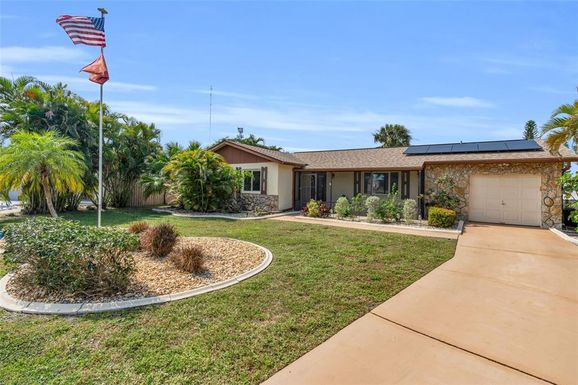
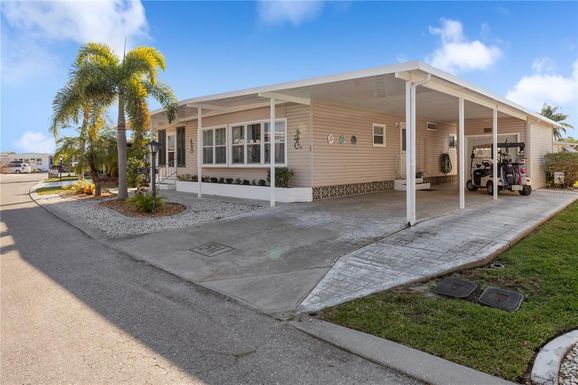
33903, FL Market Trend for Houses
Average List Price
The average list price of houses in 33903, FL, was $618,622 in May 2024, compared to $272,700 in May 2023.
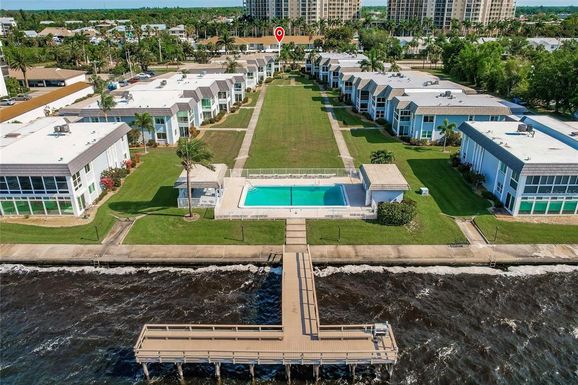
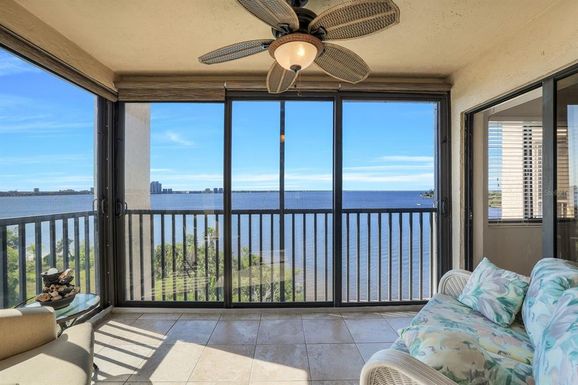
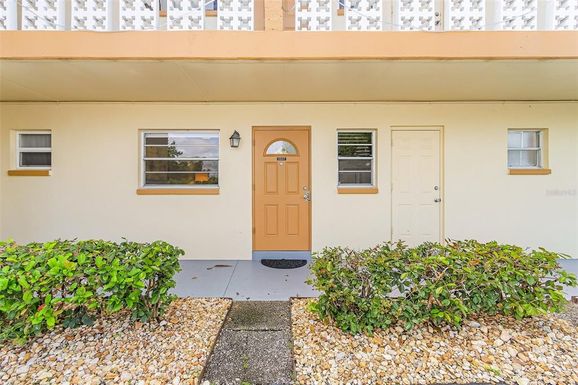
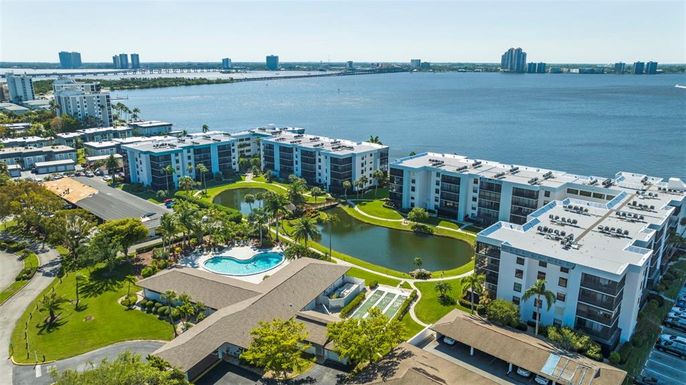
33903, FL Market Trend for Condos / Townhouses / Penthouses
Average List Price
The average list price of condos/co-ops in 33903, FL, was $254,725 in May 2024, compared to $0 in May 2023.
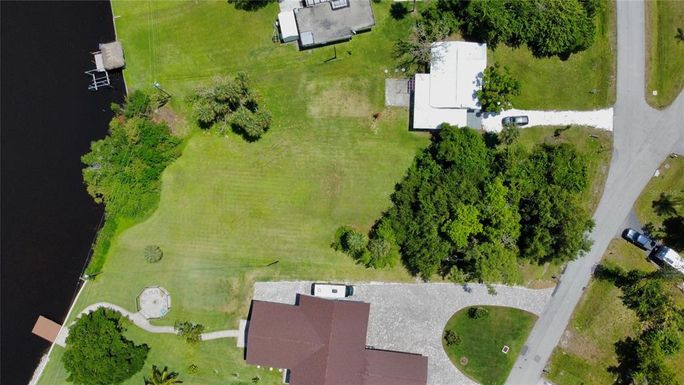
33903, FL Market Trend for Lots/Land
Average List Price
The average list price of lots/land in 33903, FL, was $129,450 in May 2024, compared to $944,995 in May 2023.
33903, FL Market Trend for Commercial
Average List Price
The average list price of commercial in 33903, FL, was $0 in May 2024, compared to $0 in May 2023.
33903, FL Housing Market Analysis
The average list price in 33903, FL is $402,165. The average list price in 33903, FL went down 14.35% from 2023 to 2024. 33903, FL home resale inventories is 20, which increased 233.33% since 2023. The average list price per square foot in 33903, FL is $275. 2023 it was $162.