In May 2024, 33956, FL homes were selling for an average price of $394,833, 33956, FL homes on average sell after 90 days on the market compared to 81 days last year. There were 9 homes sold in 33956, FL for May 2024, compared to 10 last year.
The average list price of 33956, FL, was $1,630,415 in May 2024, compared to $0 in May 2023.
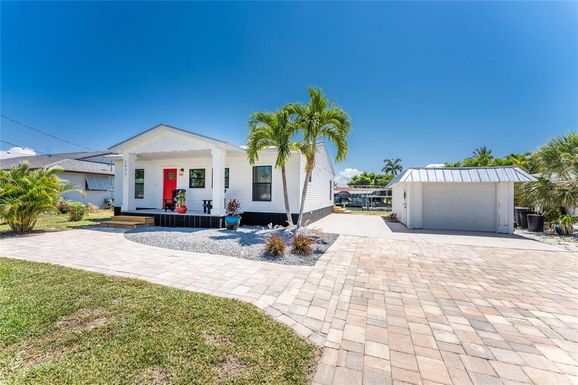
33956, FL Market Trend for Houses
Average List Price
The average list price of houses in 33956, FL, was $768,271 in May 2024, compared to $0 in May 2023.
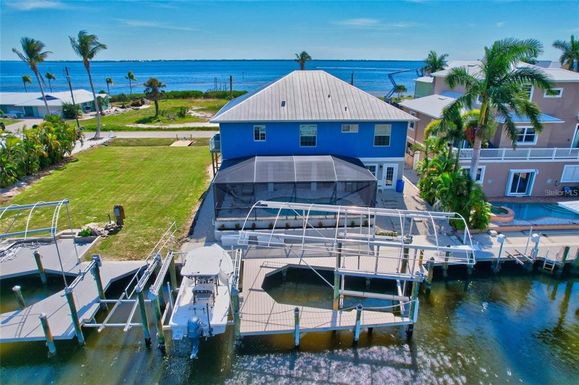
33956, FL Market Trend for Condos / Townhouses / Penthouses
Average List Price
The average list price of condos/co-ops in 33956, FL, was $0 in May 2024, compared to $0 in May 2023.
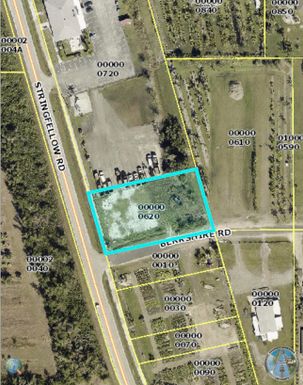
33956, FL Market Trend for Lots/Land
Average List Price
The average list price of lots/land in 33956, FL, was $3,134,500 in May 2024, compared to $0 in May 2023.
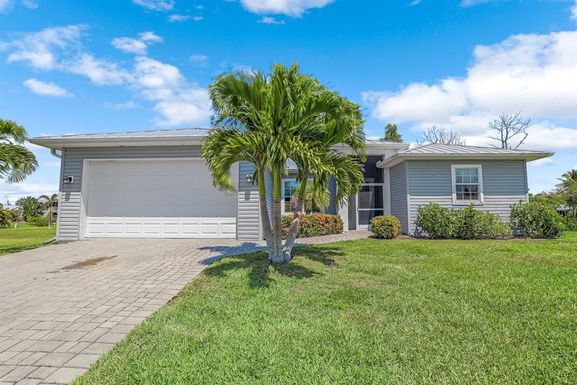
33956, FL Market Trend for Commercial
Average List Price
The average list price of commercial in 33956, FL, was $145,000 in May 2024, compared to $0 in May 2023.
33956, FL Housing Market Analysis
The average list price in 33956, FL is $1,630,415. The average list price in 33956, FL went up 482.29% from 2023 to 2024. 33956, FL home resale inventories is 13, which increased 1200.00% since 2023. The average list price per square foot in 33956, FL is $586. 2023 it was $438.