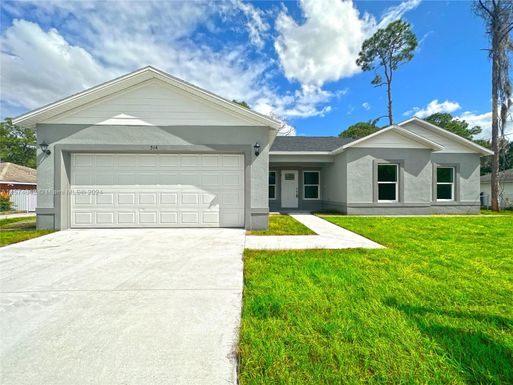
In May 2024, 33936, FL homes were selling for an average price of $176,054, 33936, FL homes on average sell after 81 days on the market compared to 70 days last year. There were 48 homes sold in 33936, FL for May 2024, compared to 44 last year.
The average list price of 33936, FL, was $308,512 in May 2024, compared to $141,229 in May 2023.
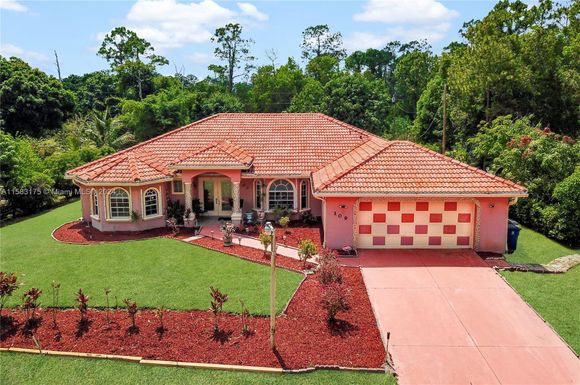
33936, FL Market Trend for Houses
Average List Price
The average list price of houses in 33936, FL, was $385,211 in May 2024, compared to $268,110 in May 2023.
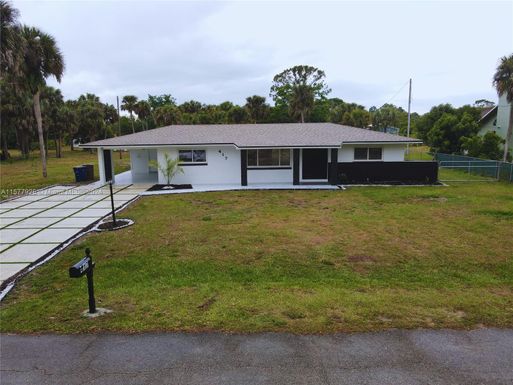
33936, FL Market Trend for Condos / Townhouses / Penthouses
Average List Price
The average list price of condos/co-ops in 33936, FL, was $199,800 in May 2024, compared to $162,500 in May 2023.
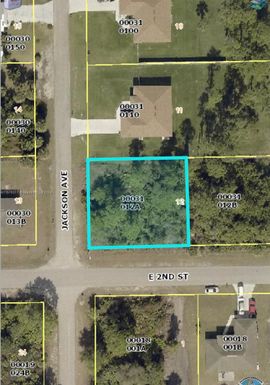
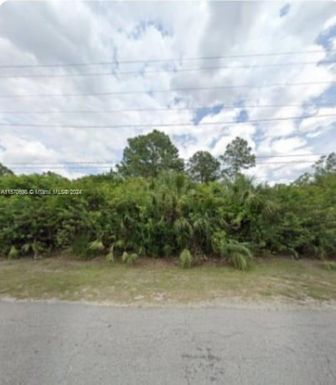
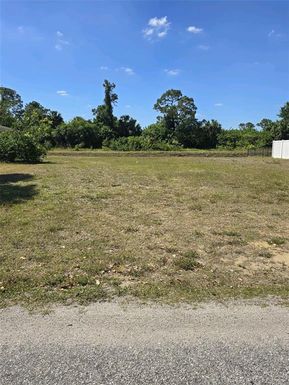
33936, FL Market Trend for Lots/Land
Average List Price
The average list price of lots/land in 33936, FL, was $317,815 in May 2024, compared to $36,089 in May 2023.
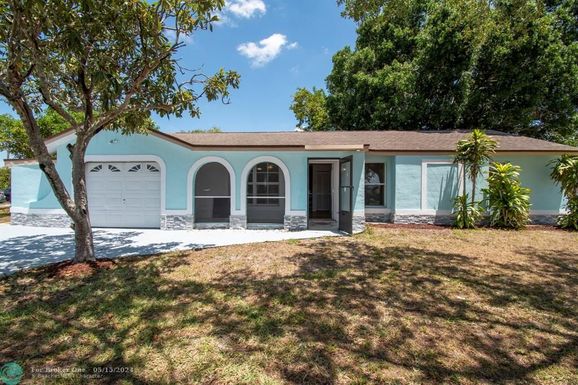
33936, FL Market Trend for Commercial
Average List Price
The average list price of commercial in 33936, FL, was $52,633 in May 2024, compared to $29,900 in May 2023.
33936, FL Housing Market Analysis
The average list price in 33936, FL is $308,512. The average list price in 33936, FL went up 102.70% from 2023 to 2024. 33936, FL home resale inventories is 33, which increased 83.33% since 2023. The average list price per square foot in 33936, FL is $216. 2023 it was $192.