In May 2024, 33905, FL homes were selling for an average price of $445,612, 33905, FL homes on average sell after 119 days on the market compared to 72 days last year. There were 61 homes sold in 33905, FL for May 2024, compared to 44 last year.
The average list price of 33905, FL, was $371,447 in May 2024, compared to $425,145 in May 2023.
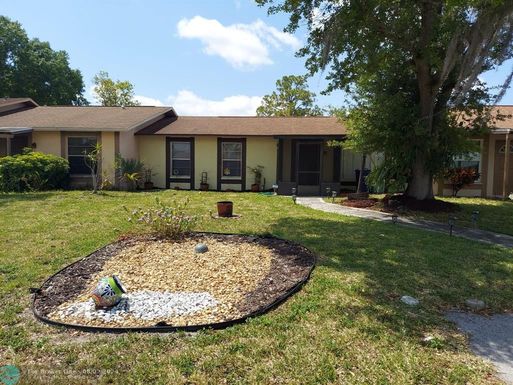
33905, FL Market Trend for Houses
Average List Price
The average list price of houses in 33905, FL, was $496,145 in May 2024, compared to $967,862 in May 2023.
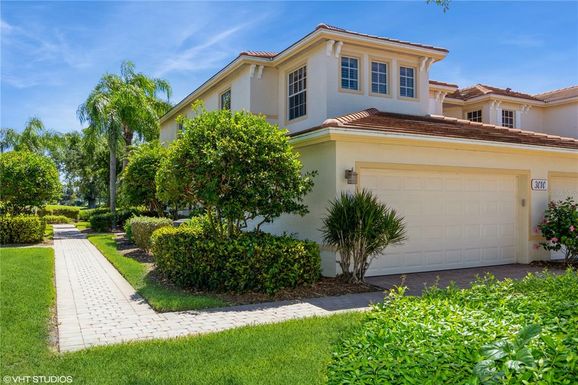
33905, FL Market Trend for Condos / Townhouses / Penthouses
Average List Price
The average list price of condos/co-ops in 33905, FL, was $258,478 in May 2024, compared to $0 in May 2023.
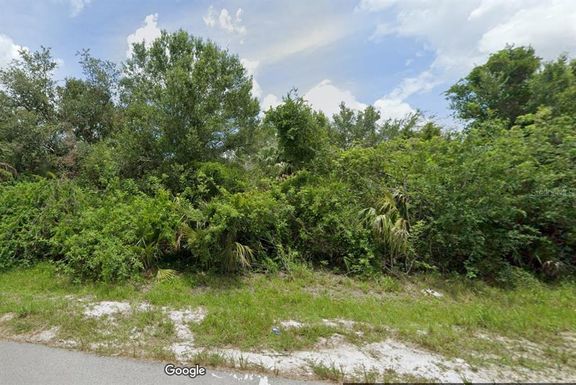
33905, FL Market Trend for Lots/Land
Average List Price
The average list price of lots/land in 33905, FL, was $127,467 in May 2024, compared to $201,764 in May 2023.
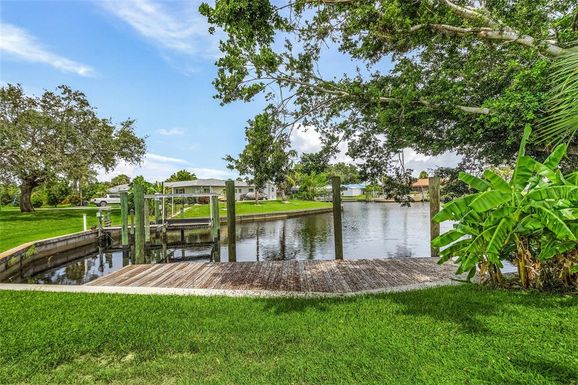
33905, FL Market Trend for Commercial
Average List Price
The average list price of commercial in 33905, FL, was $190,754 in May 2024, compared to $20,338 in May 2023.
33905, FL Housing Market Analysis
The average list price in 33905, FL is $371,447. The average list price in 33905, FL went down 21.21% from 2023 to 2024. 33905, FL home resale inventories is 36, which increased 38.46% since 2023. The average list price per square foot in 33905, FL is $277. 2023 it was $343.