In May 2024, 33913, FL homes were selling for an average price of $526,695, 33913, FL homes on average sell after 78 days on the market compared to 113 days last year. There were 26 homes sold in 33913, FL for May 2024, compared to 29 last year.
The average list price of 33913, FL, was $433,969 in May 2024, compared to $451,994 in May 2023.
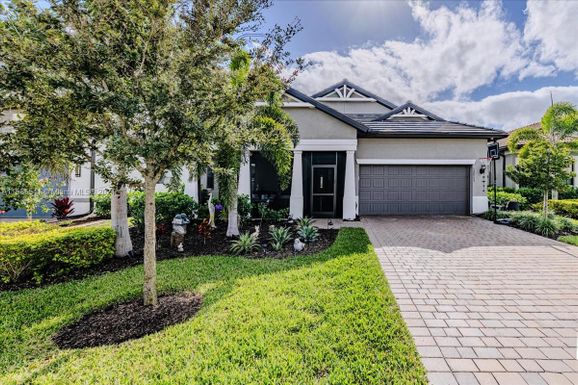
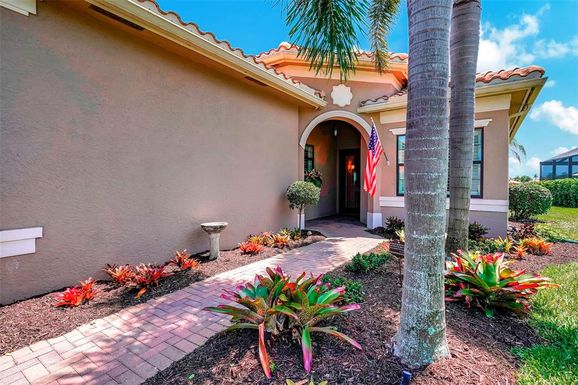
33913, FL Market Trend for Houses
Average List Price
The average list price of houses in 33913, FL, was $712,775 in May 2024, compared to $718,990 in May 2023.
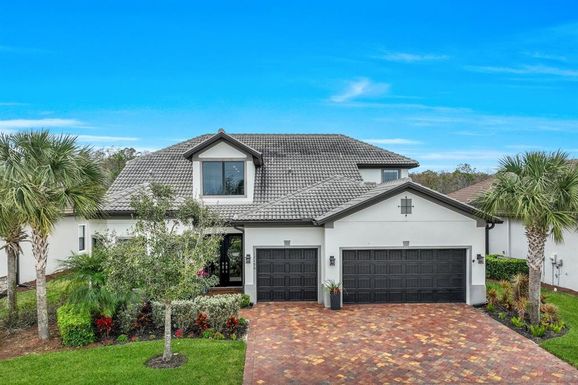
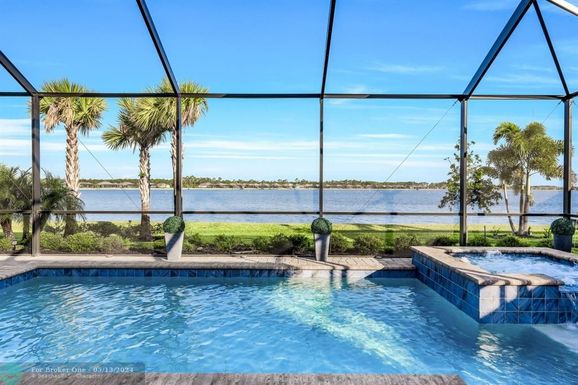
33913, FL Market Trend for Condos / Townhouses / Penthouses
Average List Price
The average list price of condos/co-ops in 33913, FL, was $338,725 in May 2024, compared to $388,996 in May 2023.
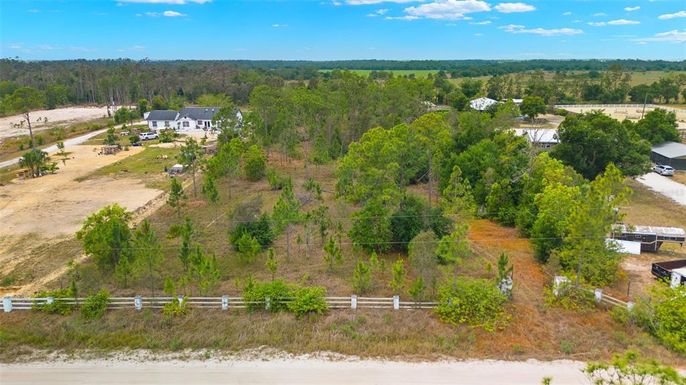
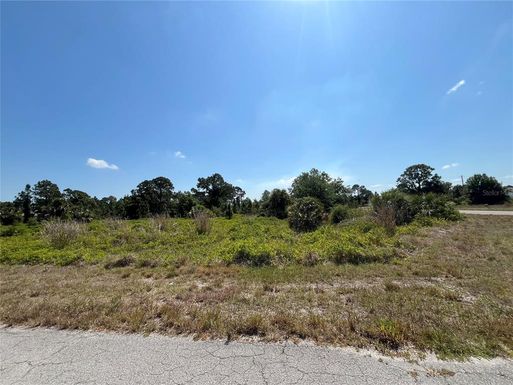
33913, FL Market Trend for Lots/Land
Average List Price
The average list price of lots/land in 33913, FL, was $91,845 in May 2024, compared to $90,000 in May 2023.
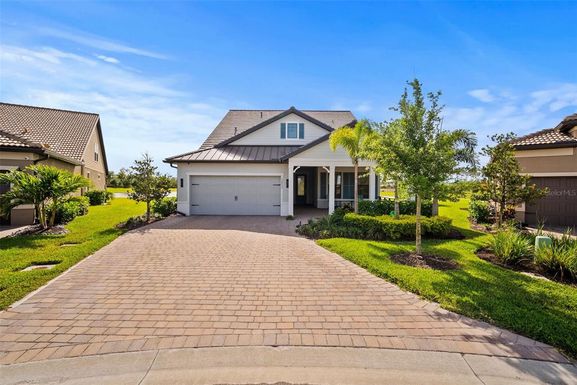
33913, FL Market Trend for Commercial
Average List Price
The average list price of commercial in 33913, FL, was $145,725 in May 2024, compared to $60,000 in May 2023.
33913, FL Housing Market Analysis
The average list price in 33913, FL is $433,969. The average list price in 33913, FL went up 29.46% from 2023 to 2024. 33913, FL home resale inventories is 38, which increased 322.22% since 2023. The average list price per square foot in 33913, FL is $289. 2023 it was $240.