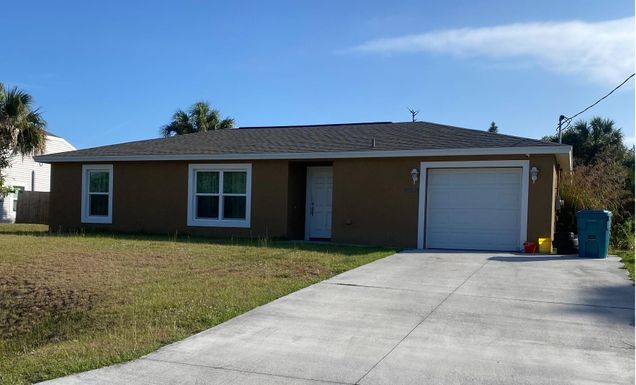
In May 2024, 33935, FL homes were selling for an average price of $208,983, 33935, FL homes on average sell after 105 days on the market compared to 117 days last year. There were 187 homes sold in 33935, FL for May 2024, compared to 134 last year.
The average list price of 33935, FL, was $318,761 in May 2024, compared to $219,463 in May 2023.
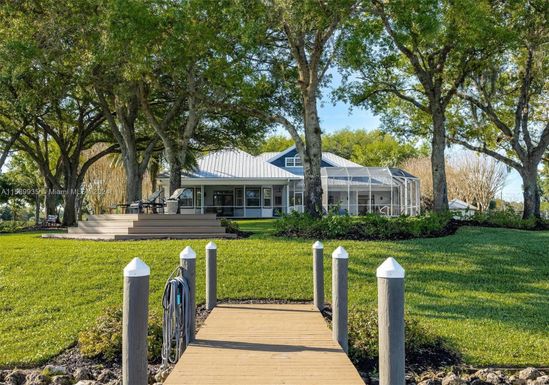
33935, FL Market Trend for Houses
Average List Price
The average list price of houses in 33935, FL, was $516,312 in May 2024, compared to $392,995 in May 2023.
33935, FL Market Trend for Condos / Townhouses / Penthouses
Average List Price
The average list price of condos/co-ops in 33935, FL, was $0 in May 2024, compared to $0 in May 2023.
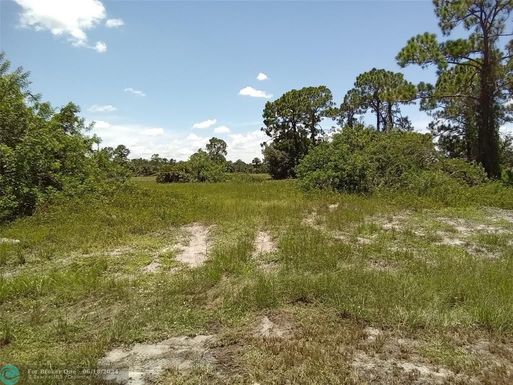
33935, FL Market Trend for Lots/Land
Average List Price
The average list price of lots/land in 33935, FL, was $55,865 in May 2024, compared to $61,155 in May 2023.
33935, FL Market Trend for Commercial
Average List Price
The average list price of commercial in 33935, FL, was $716,015 in May 2024, compared to $351,236 in May 2023.
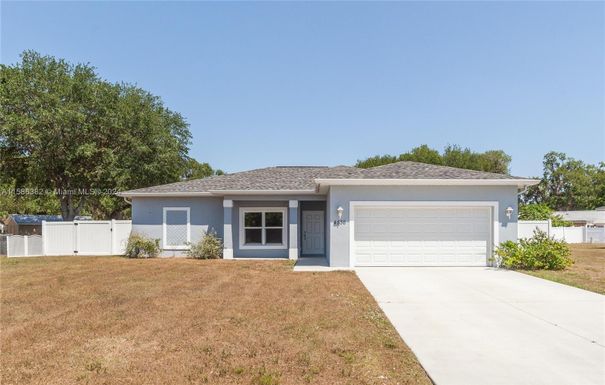
33935, FL Housing Market Analysis
The average list price in 33935, FL is $318,761. The average list price in 33935, FL went up 39.52% from 2023 to 2024. 33935, FL home resale inventories is 153, which increased 98.70% since 2023. The average list price per square foot in 33935, FL is $252. 2023 it was $235.