In May 2024, 33916, FL homes were selling for an average price of $264,028, 33916, FL homes on average sell after 86 days on the market compared to 45 days last year. There were 33 homes sold in 33916, FL for May 2024, compared to 24 last year.
The average list price of 33916, FL, was $323,851 in May 2024, compared to $235,621 in May 2023.
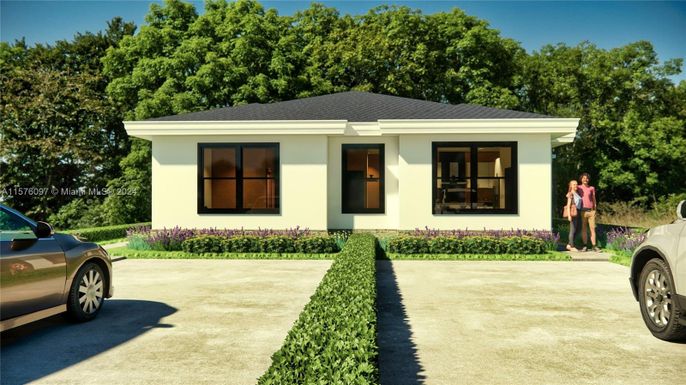
33916, FL Market Trend for Houses
Average List Price
The average list price of houses in 33916, FL, was $329,475 in May 2024, compared to $369,133 in May 2023.
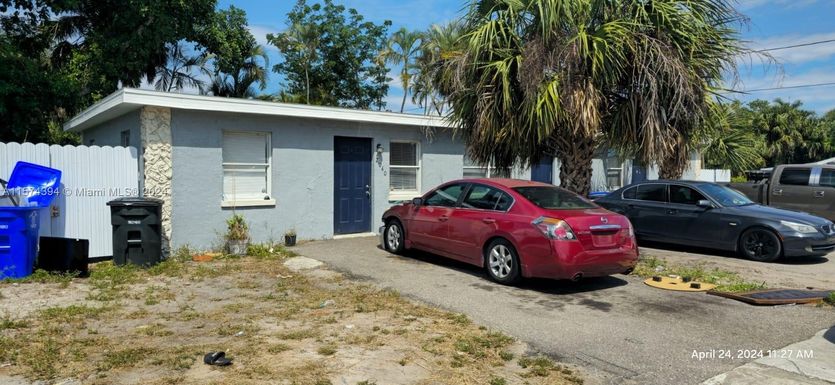
33916, FL Market Trend for Condos / Townhouses / Penthouses
Average List Price
The average list price of condos/co-ops in 33916, FL, was $296,994 in May 2024, compared to $449,000 in May 2023.
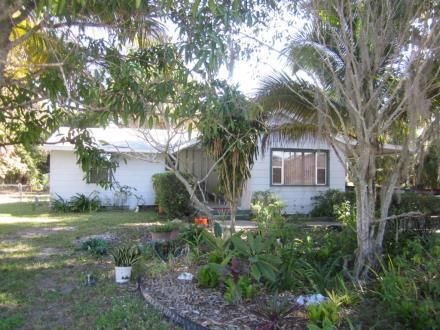
33916, FL Market Trend for Lots/Land
Average List Price
The average list price of lots/land in 33916, FL, was $0 in May 2024, compared to $33,250 in May 2023.
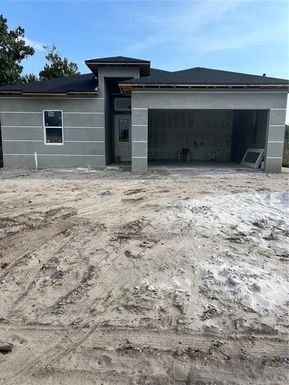
33916, FL Market Trend for Commercial
Average List Price
The average list price of commercial in 33916, FL, was $35,950 in May 2024, compared to $35,950 in May 2023.
33916, FL Housing Market Analysis
The average list price in 33916, FL is $323,851. The average list price in 33916, FL went up 21.42% from 2023 to 2024. 33916, FL home resale inventories is 17, which increased 41.67% since 2023. The average list price per square foot in 33916, FL is $235. 2023 it was $229.