In May 2024, 33919, FL homes were selling for an average price of $600,878, 33919, FL homes on average sell after 46 days on the market compared to 32 days last year. There were 38 homes sold in 33919, FL for May 2024, compared to 24 last year.
The average list price of 33919, FL, was $664,211 in May 2024, compared to $1,760,700 in May 2023.
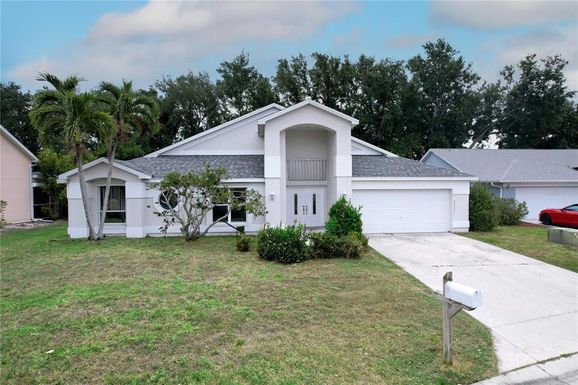
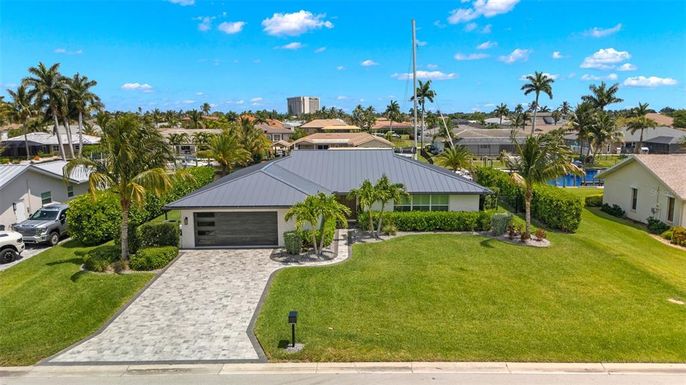
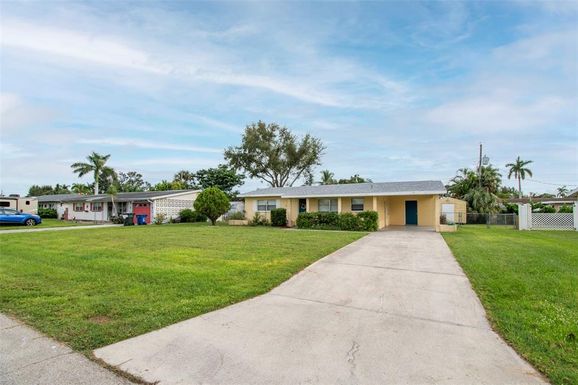
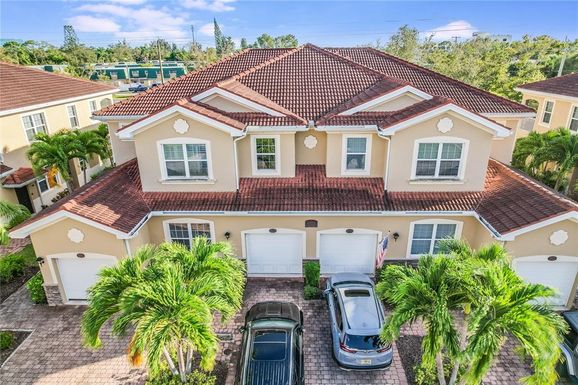
33919, FL Market Trend for Houses
Average List Price
The average list price of houses in 33919, FL, was $1,082,050 in May 2024, compared to $5,675,000 in May 2023.
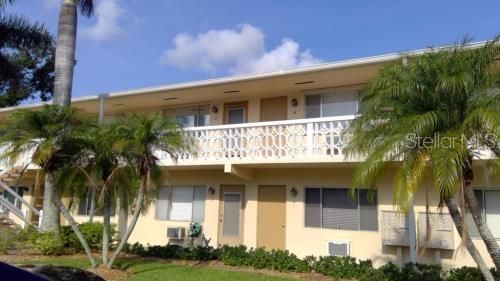
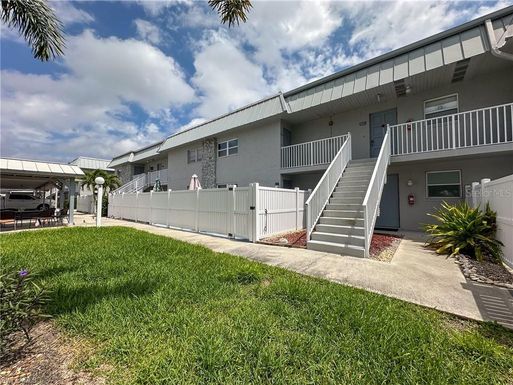
33919, FL Market Trend for Condos / Townhouses / Penthouses
Average List Price
The average list price of condos/co-ops in 33919, FL, was $263,015 in May 2024, compared to $236,225 in May 2023.
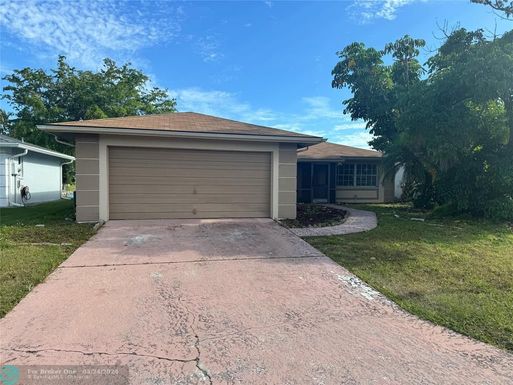
33919, FL Market Trend for Lots/Land
Average List Price
The average list price of lots/land in 33919, FL, was $30,000 in May 2024, compared to $30,000 in May 2023.
33919, FL Market Trend for Commercial
Average List Price
The average list price of commercial in 33919, FL, was $0 in May 2024, compared to $0 in May 2023.
33919, FL Housing Market Analysis
The average list price in 33919, FL is $664,211. The average list price in 33919, FL went down 62.28% from 2023 to 2024. 33919, FL home resale inventories is 28, which increased 300.00% since 2023. The average list price per square foot in 33919, FL is $302. 2023 it was $468.