In May 2024, 32169, FL homes were selling for an average price of $764,249, 32169, FL homes on average sell after 79 days on the market compared to 50 days last year. There were 585 homes sold in 32169, FL for May 2024, compared to 732 last year.
The average list price of 32169, FL, was $992,456 in May 2024, compared to $718,561 in May 2023.
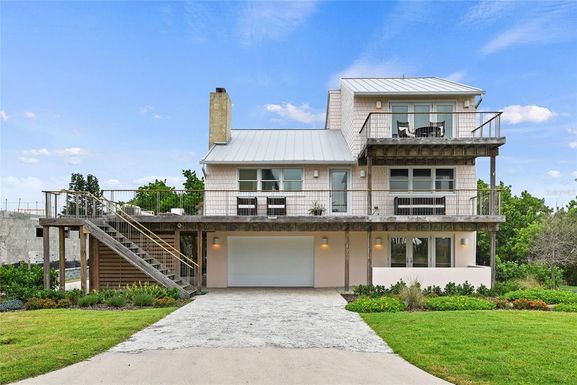
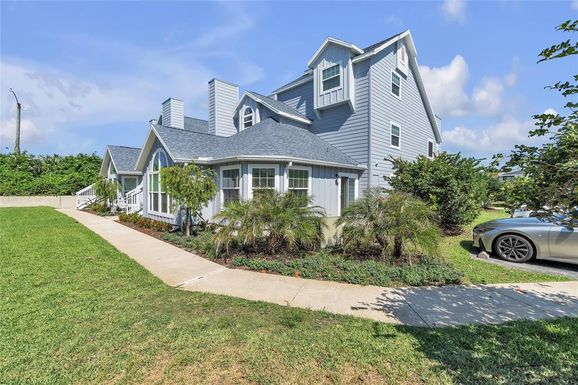
32169, FL Market Trend for Houses
Average List Price
The average list price of houses in 32169, FL, was $1,486,086 in May 2024, compared to $847,555 in May 2023.
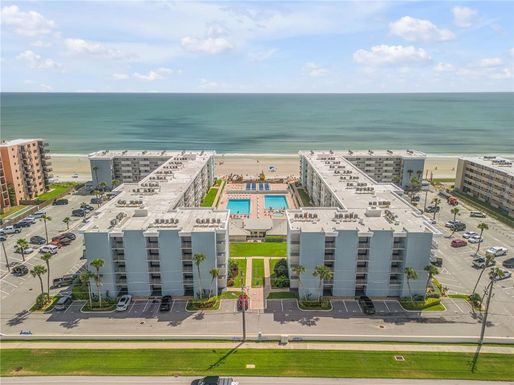
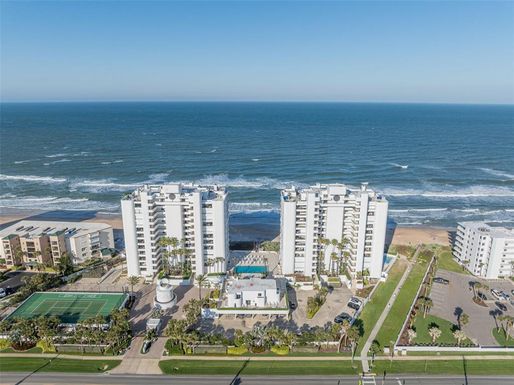
32169, FL Market Trend for Condos / Townhouses / Penthouses
Average List Price
The average list price of condos/co-ops in 32169, FL, was $615,885 in May 2024, compared to $611,526 in May 2023.
32169, FL Market Trend for Lots/Land
Average List Price
The average list price of lots/land in 32169, FL, was $730,704 in May 2024, compared to $388,454 in May 2023.
32169, FL Market Trend for Commercial
Average List Price
The average list price of commercial in 32169, FL, was $8,091,500 in May 2024, compared to $2,250,000 in May 2023.
32169, FL Housing Market Analysis
The average list price in 32169, FL is $992,456. The average list price in 32169, FL went up 39.67% from 2023 to 2024. 32169, FL home resale inventories is 359, which increased 95.11% since 2023. The average list price per square foot in 32169, FL is $553. 2023 it was $473.