In May 2024, 32129, FL homes were selling for an average price of $332,098, 32129, FL homes on average sell after 53 days on the market compared to 28 days last year. There were 135 homes sold in 32129, FL for May 2024, compared to 153 last year.
The average list price of 32129, FL, was $348,216 in May 2024, compared to $340,564 in May 2023.
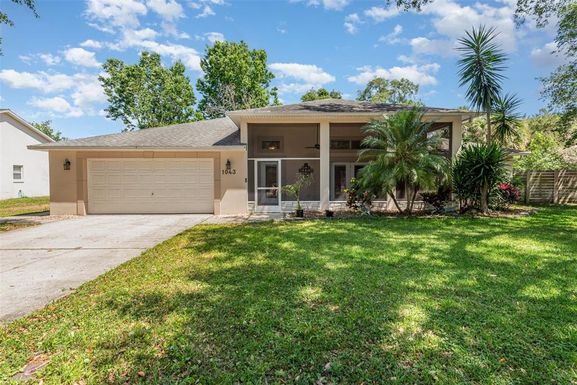
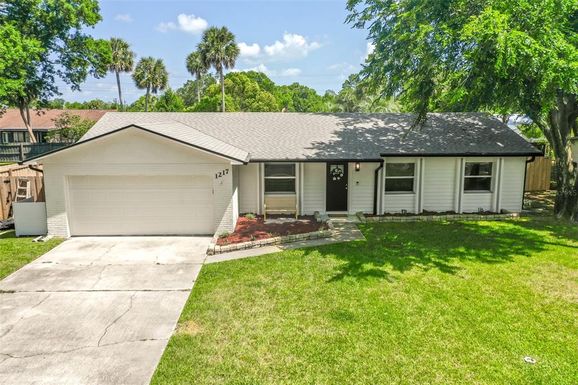
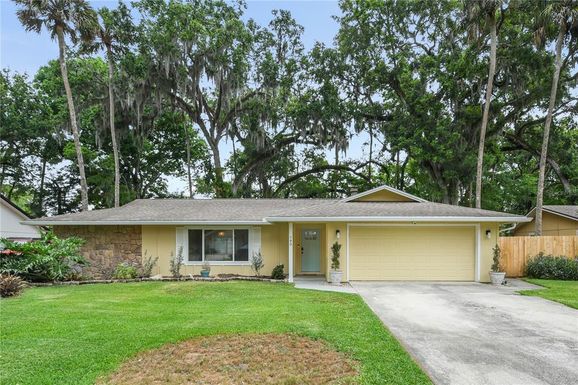
32129, FL Market Trend for Houses
Average List Price
The average list price of houses in 32129, FL, was $363,017 in May 2024, compared to $379,120 in May 2023.
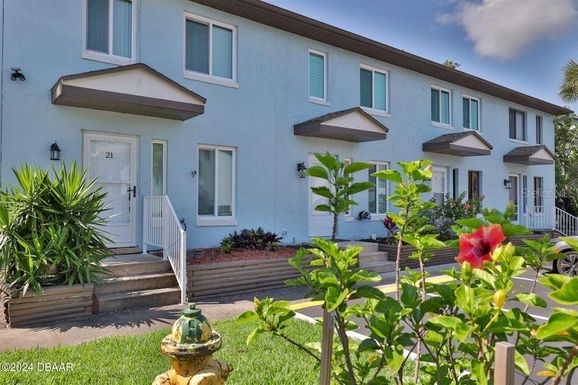
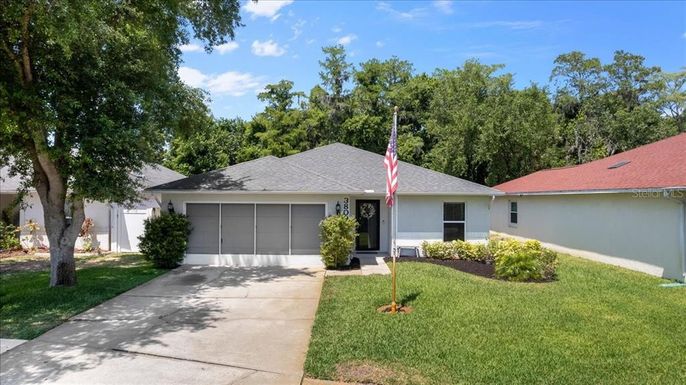
32129, FL Market Trend for Condos / Townhouses / Penthouses
Average List Price
The average list price of condos/co-ops in 32129, FL, was $276,167 in May 2024, compared to $288,739 in May 2023.
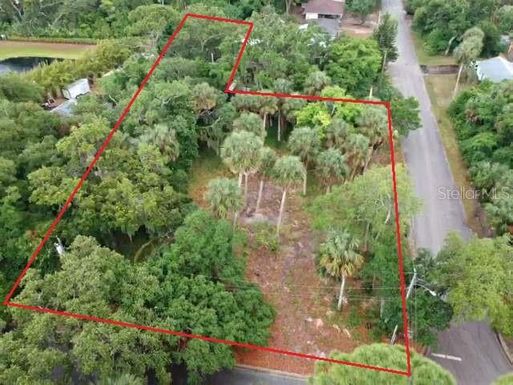
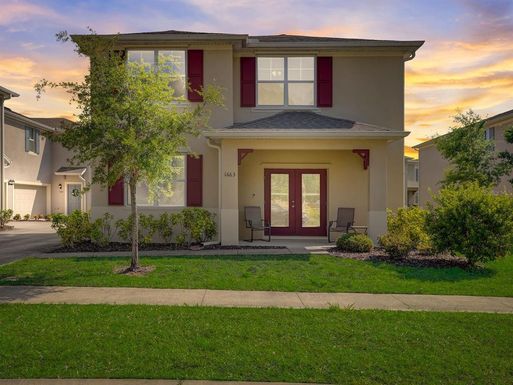
32129, FL Market Trend for Lots/Land
Average List Price
The average list price of lots/land in 32129, FL, was $474,000 in May 2024, compared to $225,000 in May 2023.
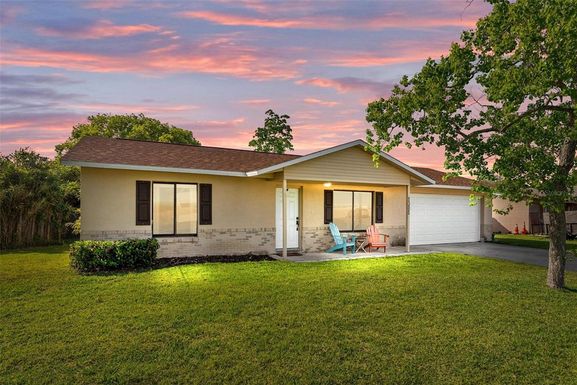
32129, FL Market Trend for Commercial
Average List Price
The average list price of commercial in 32129, FL, was $0 in May 2024, compared to $0 in May 2023.
32129, FL Housing Market Analysis
The average list price in 32129, FL is $348,216. The average list price in 32129, FL went down 3.20% from 2023 to 2024. 32129, FL home resale inventories is 38, which increased 8.57% since 2023. The average list price per square foot in 32129, FL is $218. 2023 it was $211.