In May 2024, Ormond Beach, FL homes were selling for an average price of $519,570, Ormond Beach, FL homes on average sell after 70 days on the market compared to 42 days last year. There were 674 homes sold in Ormond Beach, FL for May 2024, compared to 574 last year.
The average list price of Ormond Beach, FL, was $566,397 in May 2024, compared to $536,016 in May 2023.
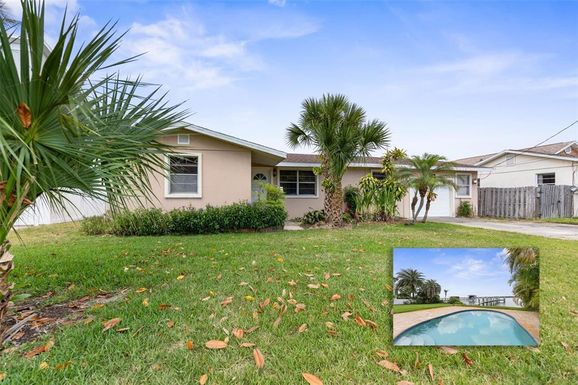
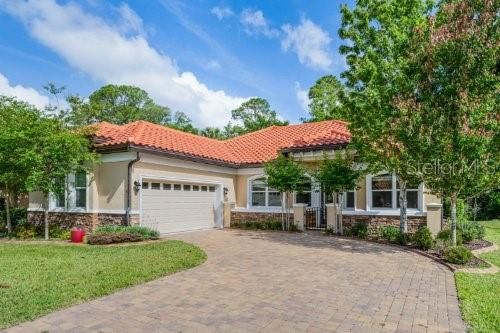
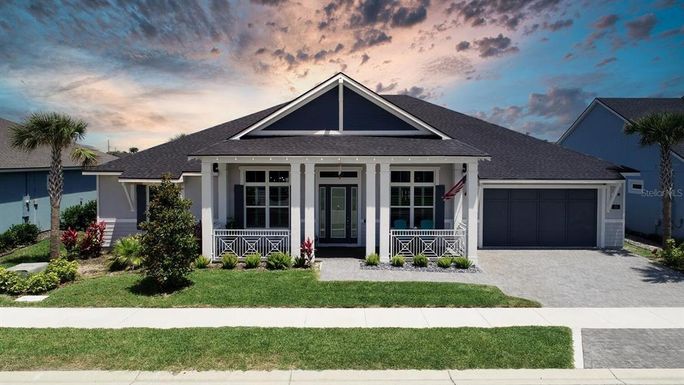
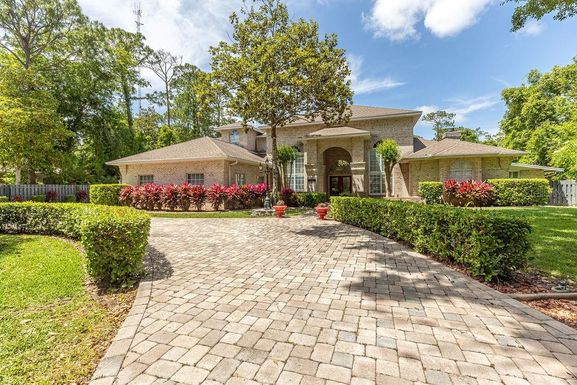
Ormond Beach, FL Market Trend for Houses
Average List Price
The average list price of houses in Ormond Beach, FL, was $649,934 in May 2024, compared to $598,529 in May 2023.
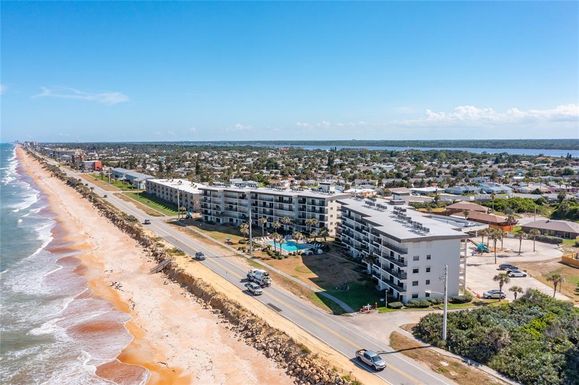
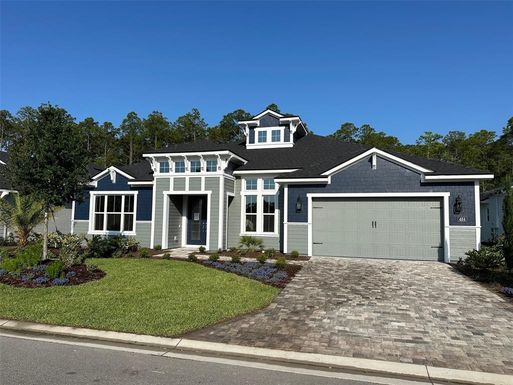
Ormond Beach, FL Market Trend for Condos / Townhouses / Penthouses
Average List Price
The average list price of condos/co-ops in Ormond Beach, FL, was $341,091 in May 2024, compared to $425,939 in May 2023.
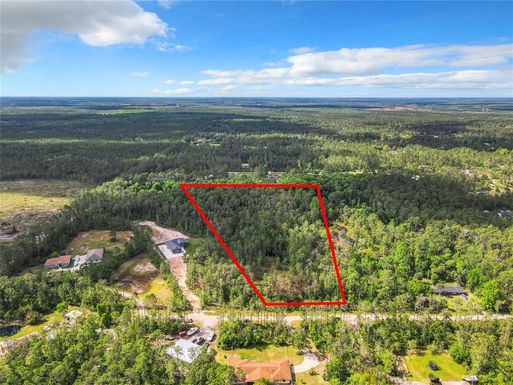
Ormond Beach, FL Market Trend for Lots/Land
Average List Price
The average list price of lots/land in Ormond Beach, FL, was $532,727 in May 2024, compared to $239,625 in May 2023.
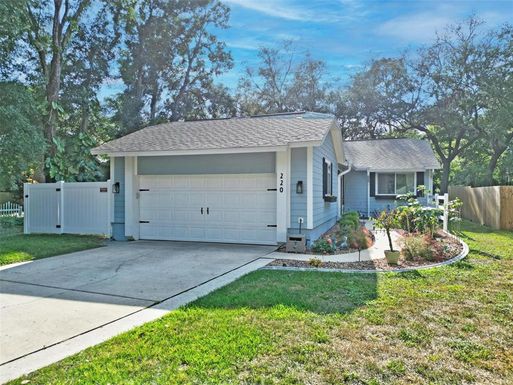
Ormond Beach, FL Market Trend for Commercial
Average List Price
The average list price of commercial in Ormond Beach, FL, was $758,000 in May 2024, compared to $0 in May 2023.
Ormond Beach, FL Housing Market Analysis
The average list price in Ormond Beach, FL is $566,397. The average list price in Ormond Beach, FL went down 5.62% from 2023 to 2024. Ormond Beach, FL home resale inventories is 355, which increased 70.67% since 2023. The average list price per square foot in Ormond Beach, FL is $289. 2023 it was $266.