In May 2024, Plant City, FL homes were selling for an average price of $374,160, Plant City, FL homes on average sell after 48 days on the market compared to 51 days last year. There were 1246 homes sold in Plant City, FL for May 2024, compared to 1093 last year.
The average list price of Plant City, FL, was $520,649 in May 2024, compared to $415,585 in May 2023.
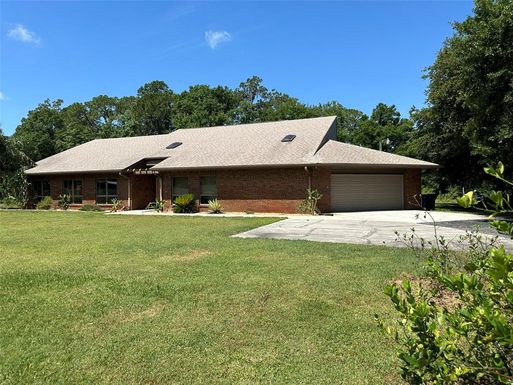
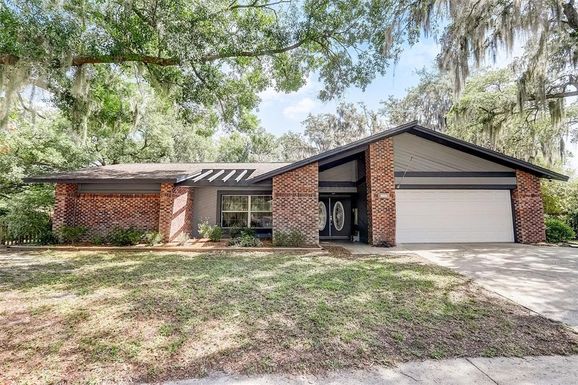
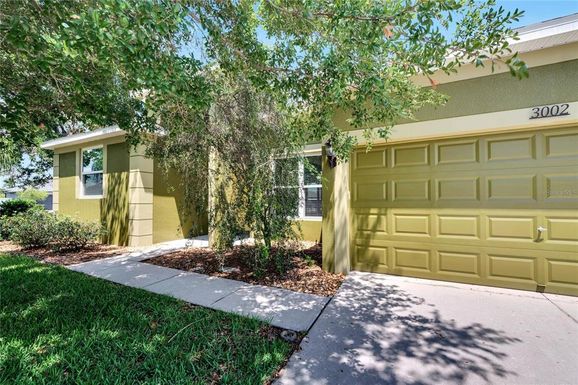
Plant City, FL Market Trend for Houses
Average List Price
The average list price of houses in Plant City, FL, was $479,519 in May 2024, compared to $424,770 in May 2023.
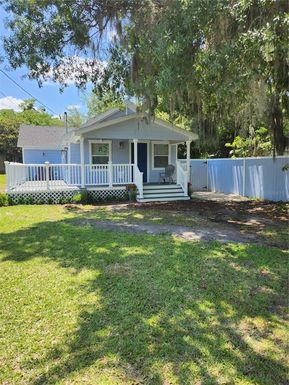
Plant City, FL Market Trend for Condos / Townhouses / Penthouses
Average List Price
The average list price of condos/co-ops in Plant City, FL, was $274,996 in May 2024, compared to $278,563 in May 2023.
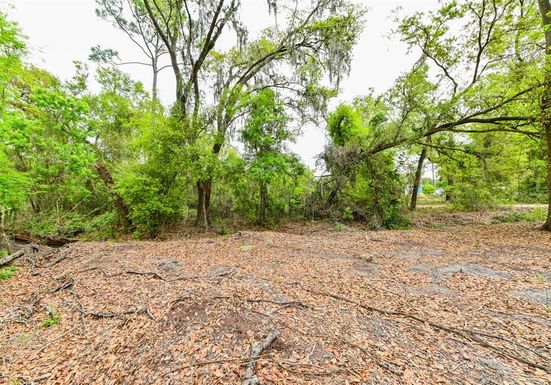
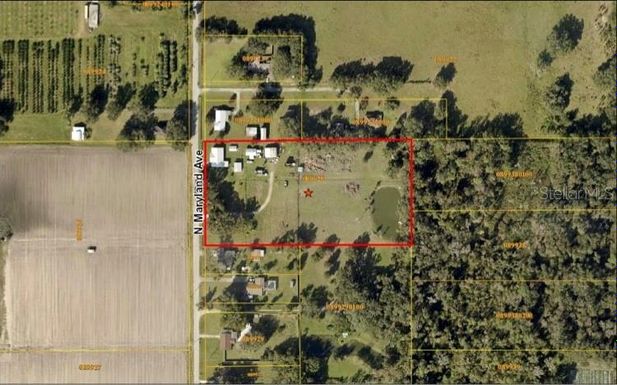
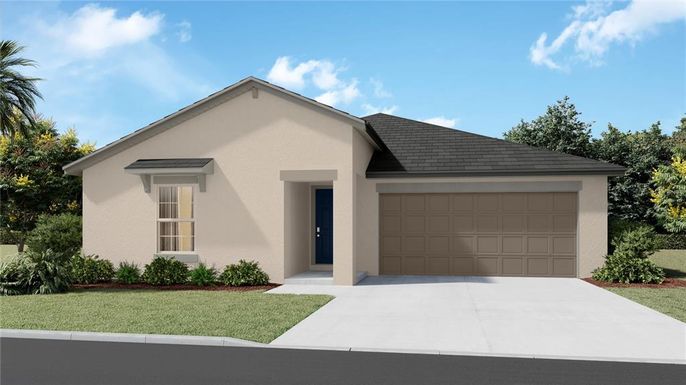
Plant City, FL Market Trend for Lots/Land
Average List Price
The average list price of lots/land in Plant City, FL, was $661,095 in May 2024, compared to $489,923 in May 2023.
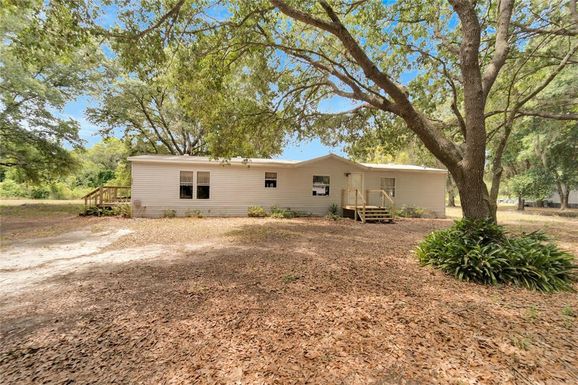
Plant City, FL Market Trend for Commercial
Average List Price
The average list price of commercial in Plant City, FL, was $967,706 in May 2024, compared to $363,408 in May 2023.
Plant City, FL Housing Market Analysis
The average list price in Plant City, FL is $520,649. The average list price in Plant City, FL went up 26.86% from 2023 to 2024. Plant City, FL home resale inventories is 337, which decreased 7.42% since 2023. The average list price per square foot in Plant City, FL is $239. 2023 it was $201.