In May 2024, Mulberry, FL homes were selling for an average price of $302,855, Mulberry, FL homes on average sell after 50 days on the market compared to 37 days last year. There were 334 homes sold in Mulberry, FL for May 2024, compared to 396 last year.
The average list price of Mulberry, FL, was $397,585 in May 2024, compared to $293,229 in May 2023.
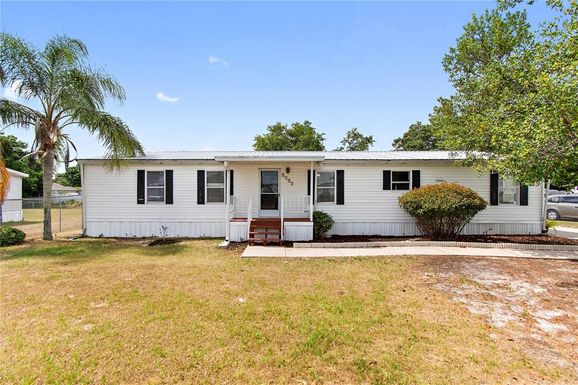
Mulberry, FL Market Trend for Houses
Average List Price
The average list price of houses in Mulberry, FL, was $504,074 in May 2024, compared to $345,665 in May 2023.
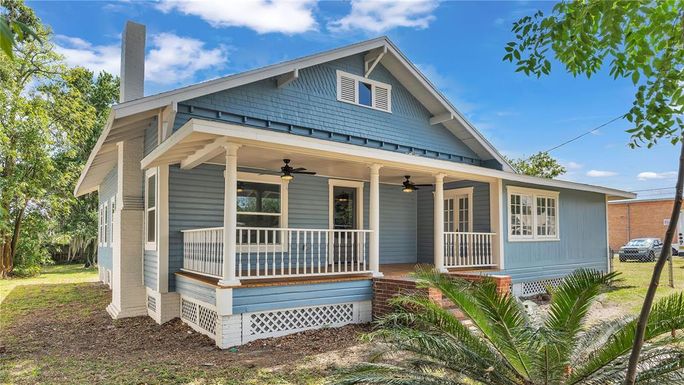
Mulberry, FL Market Trend for Condos / Townhouses / Penthouses
Average List Price
The average list price of condos/co-ops in Mulberry, FL, was $210,100 in May 2024, compared to $139,000 in May 2023.
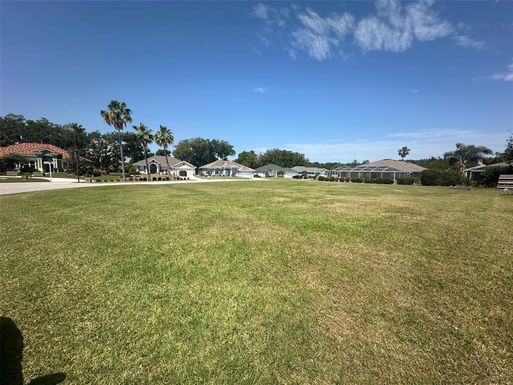
Mulberry, FL Market Trend for Lots/Land
Average List Price
The average list price of lots/land in Mulberry, FL, was $212,764 in May 2024, compared to $128,231 in May 2023.
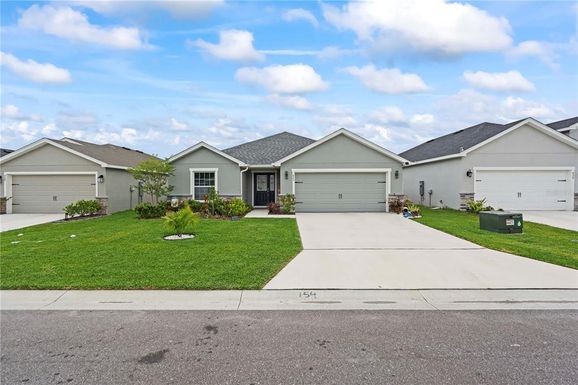
Mulberry, FL Market Trend for Commercial
Average List Price
The average list price of commercial in Mulberry, FL, was $347,975 in May 2024, compared to $504,850 in May 2023.
Mulberry, FL Housing Market Analysis
The average list price in Mulberry, FL is $397,585. The average list price in Mulberry, FL went up 33.30% from 2023 to 2024. Mulberry, FL home resale inventories is 105, which increased 31.25% since 2023. The average list price per square foot in Mulberry, FL is $206. 2023 it was $192.