In May 2024, Oakland, FL homes were selling for an average price of $470,134, Oakland, FL homes on average sell after 49 days on the market compared to 42 days last year. There were 973 homes sold in Oakland, FL for May 2024, compared to 961 last year.
The average list price of Oakland, FL, was $620,142 in May 2024, compared to $597,584 in May 2023.
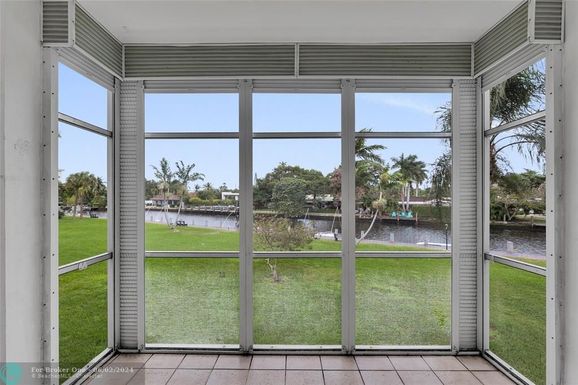
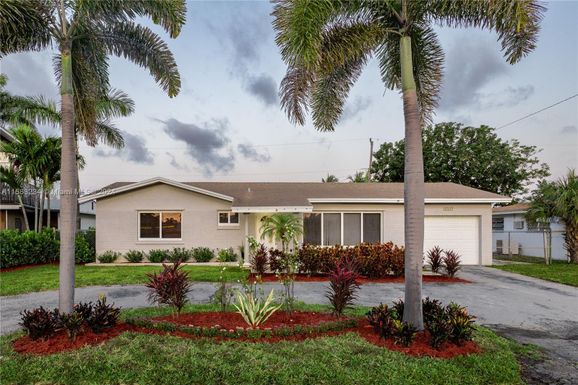
Oakland, FL Market Trend for Houses
Average List Price
The average list price of houses in Oakland, FL, was $751,538 in May 2024, compared to $721,397 in May 2023.
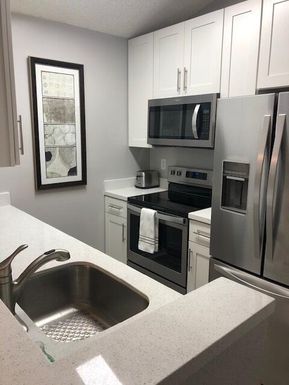
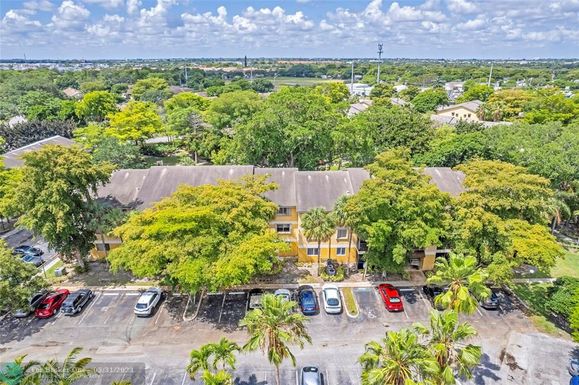
Oakland, FL Market Trend for Condos / Townhouses / Penthouses
Average List Price
The average list price of condos/co-ops in Oakland, FL, was $267,579 in May 2024, compared to $281,860 in May 2023.
Oakland, FL Market Trend for Lots/Land
Average List Price
The average list price of lots/land in Oakland, FL, was $855,828 in May 2024, compared to $834,375 in May 2023.
Oakland, FL Market Trend for Commercial
Average List Price
The average list price of commercial in Oakland, FL, was $1,875,432 in May 2024, compared to $1,098,965 in May 2023.
Oakland, FL Housing Market Analysis
The average list price in Oakland, FL is $620,142. The average list price in Oakland, FL went up 8.54% from 2023 to 2024. Oakland, FL home resale inventories is 440, which increased 89.66% since 2023. The average list price per square foot in Oakland, FL is $348. 2023 it was $352.