In May 2024, 34711, FL homes were selling for an average price of $490,278, 34711, FL homes on average sell after 54 days on the market compared to 47 days last year. There were 1201 homes sold in 34711, FL for May 2024, compared to 1260 last year.
The average list price of 34711, FL, was $669,361 in May 2024, compared to $594,754 in May 2023.
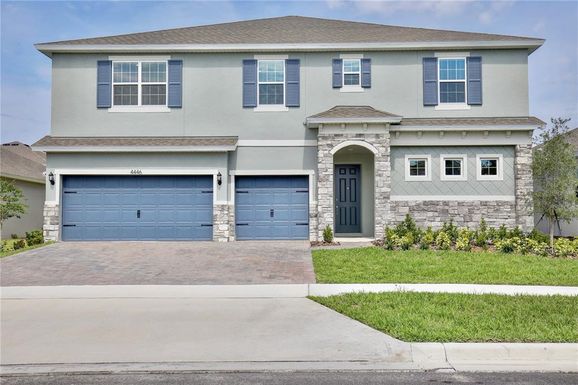
34711, FL Market Trend for Houses
Average List Price
The average list price of houses in 34711, FL, was $626,534 in May 2024, compared to $530,196 in May 2023.
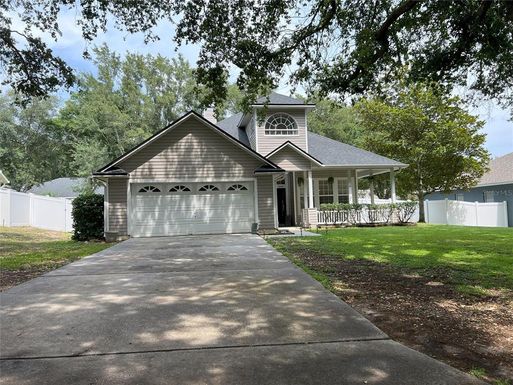
34711, FL Market Trend for Condos / Townhouses / Penthouses
Average List Price
The average list price of condos/co-ops in 34711, FL, was $314,990 in May 2024, compared to $324,444 in May 2023.
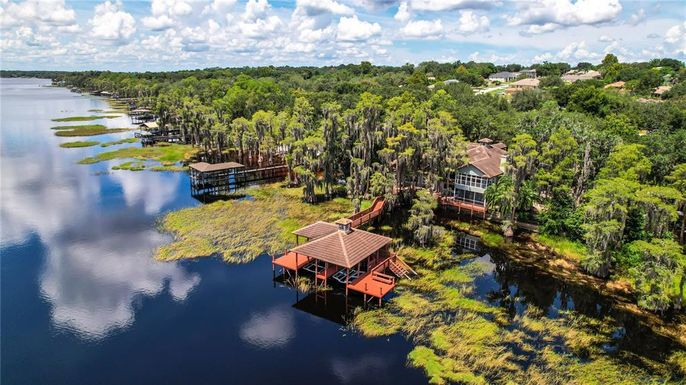
34711, FL Market Trend for Lots/Land
Average List Price
The average list price of lots/land in 34711, FL, was $752,426 in May 2024, compared to $809,174 in May 2023.
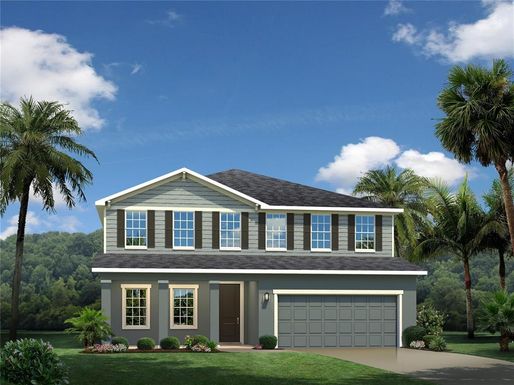
34711, FL Market Trend for Commercial
Average List Price
The average list price of commercial in 34711, FL, was $2,738,428 in May 2024, compared to $2,408,428 in May 2023.
34711, FL Housing Market Analysis
The average list price in 34711, FL is $669,361. The average list price in 34711, FL went up 9.88% from 2023 to 2024. 34711, FL home resale inventories is 314, which decreased 7.92% since 2023. The average list price per square foot in 34711, FL is $255. 2023 it was $233.