In May 2024, 32835, FL homes were selling for an average price of $366,082, 32835, FL homes on average sell after 38 days on the market compared to 31 days last year. There were 598 homes sold in 32835, FL for May 2024, compared to 693 last year.
The average list price of 32835, FL, was $410,309 in May 2024, compared to $396,228 in May 2023.
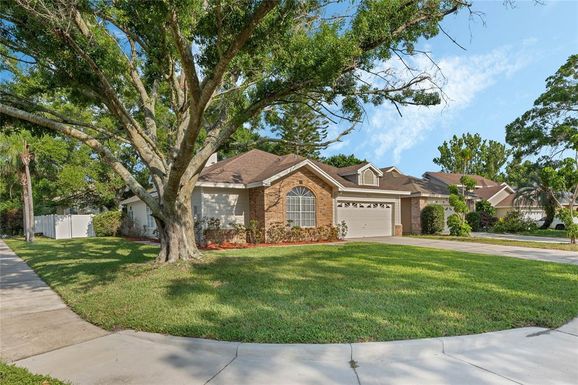
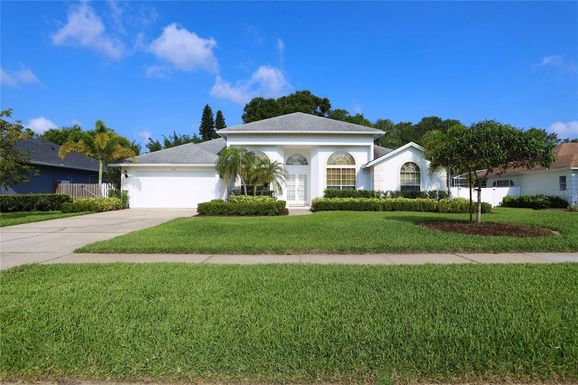
32835, FL Market Trend for Houses
Average List Price
The average list price of houses in 32835, FL, was $759,962 in May 2024, compared to $603,095 in May 2023.
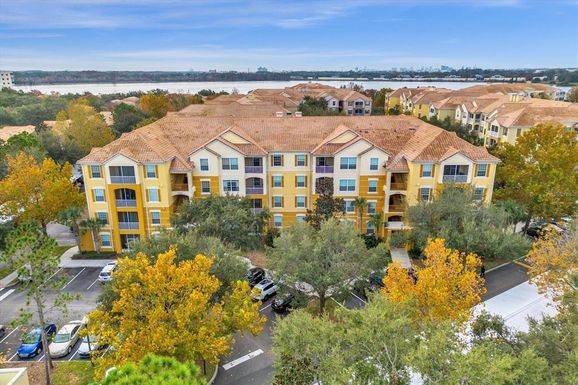
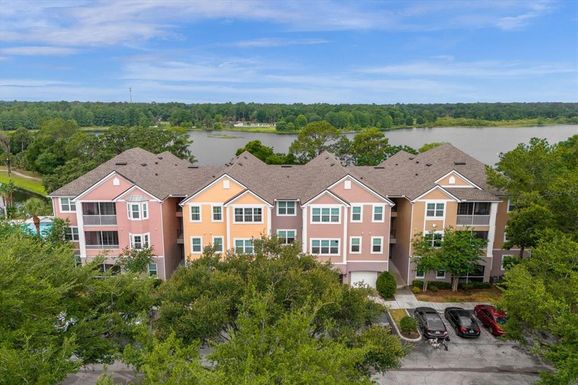
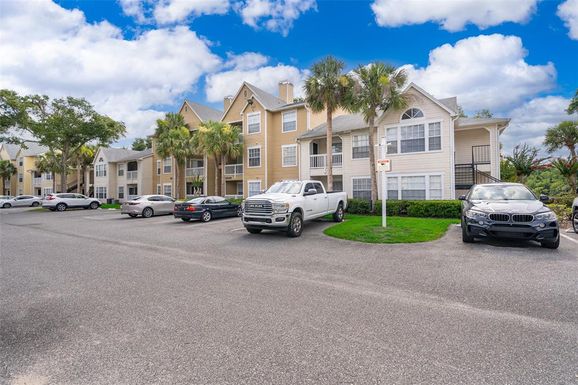
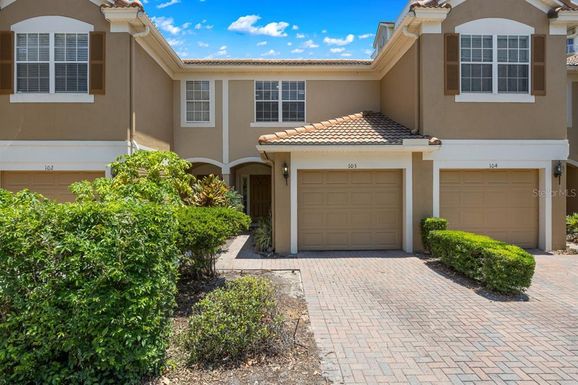
32835, FL Market Trend for Condos / Townhouses / Penthouses
Average List Price
The average list price of condos/co-ops in 32835, FL, was $252,967 in May 2024, compared to $236,392 in May 2023.
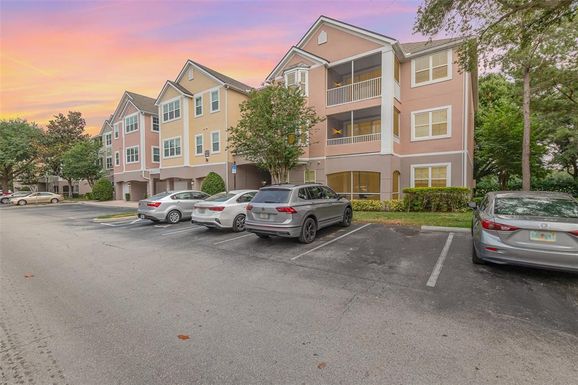
32835, FL Market Trend for Lots/Land
Average List Price
The average list price of lots/land in 32835, FL, was $1,654,000 in May 2024, compared to $1,128,000 in May 2023.
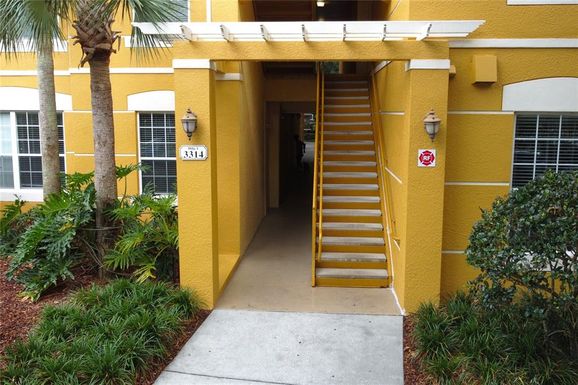
32835, FL Market Trend for Commercial
Average List Price
The average list price of commercial in 32835, FL, was $306,900 in May 2024, compared to $260,271 in May 2023.
32835, FL Housing Market Analysis
The average list price in 32835, FL is $410,309. The average list price in 32835, FL went up 0.46% from 2023 to 2024. 32835, FL home resale inventories is 180, which increased 29.50% since 2023. The average list price per square foot in 32835, FL is $232. 2023 it was $223.