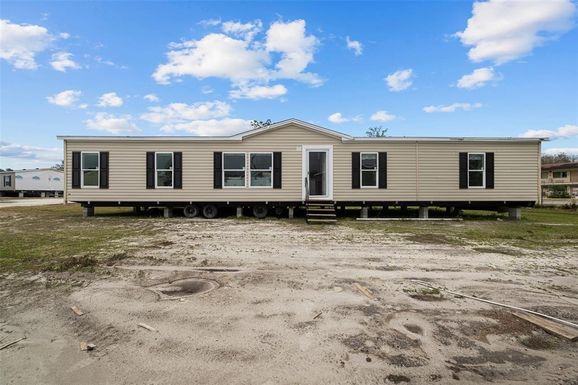
In May 2024, Chiefland, FL homes were selling for an average price of $178,923, Chiefland, FL homes on average sell after 76 days on the market compared to 88 days last year. There were 55 homes sold in Chiefland, FL for May 2024, compared to 48 last year.
The average list price of Chiefland, FL, was $136,120 in May 2024, compared to $140,959 in May 2023.
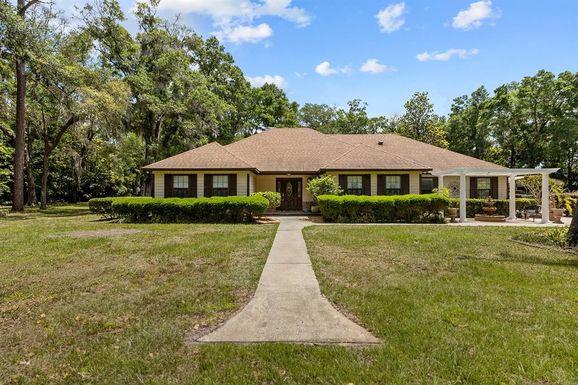
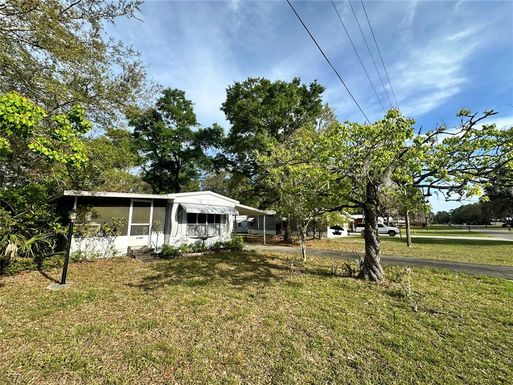
Chiefland, FL Market Trend for Houses
Average List Price
The average list price of houses in Chiefland, FL, was $376,875 in May 2024, compared to $290,600 in May 2023.
Chiefland, FL Market Trend for Condos / Townhouses / Penthouses
Average List Price
The average list price of condos/co-ops in Chiefland, FL, was $0 in May 2024, compared to $0 in May 2023.
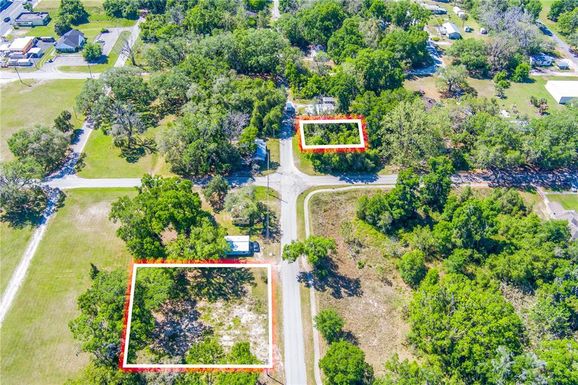
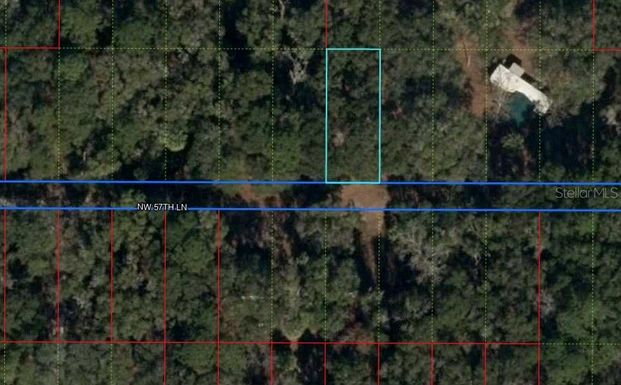
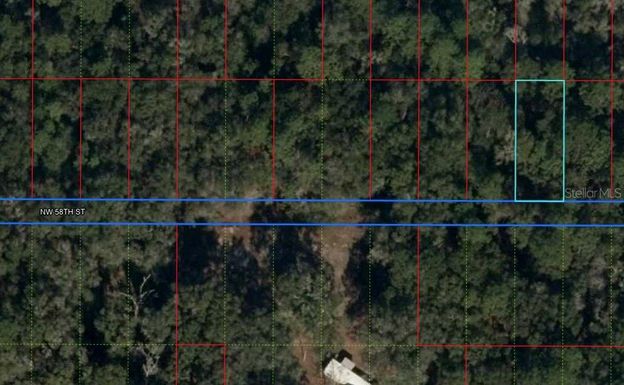
Chiefland, FL Market Trend for Lots/Land
Average List Price
The average list price of lots/land in Chiefland, FL, was $63,535 in May 2024, compared to $72,080 in May 2023.
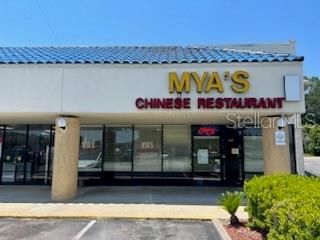
Chiefland, FL Market Trend for Commercial
Average List Price
The average list price of commercial in Chiefland, FL, was $173,400 in May 2024, compared to $91,167 in May 2023.
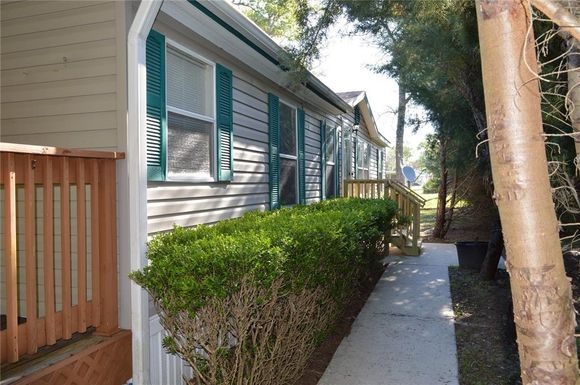
Chiefland, FL Housing Market Analysis
The average list price in Chiefland, FL is $136,120. The average list price in Chiefland, FL went up 0.10% from 2023 to 2024. Chiefland, FL home resale inventories is 63, which increased 142.31% since 2023. The average list price per square foot in Chiefland, FL is $180. 2023 it was $162.