In May 2024, Bell, FL homes were selling for an average price of $433,455, Bell, FL homes on average sell after 84 days on the market compared to 59 days last year. There were 1127 homes sold in Bell, FL for May 2024, compared to 1075 last year.
The average list price of Bell, FL, was $643,166 in May 2024, compared to $543,669 in May 2023.
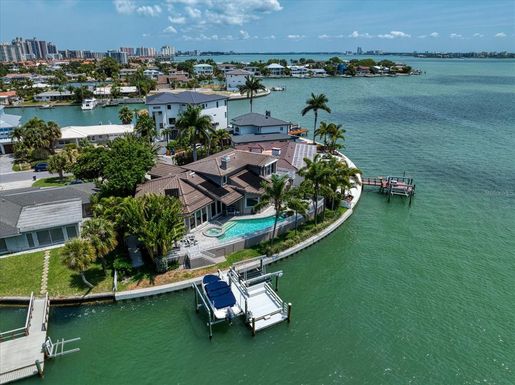
Bell, FL Market Trend for Houses
Average List Price
The average list price of houses in Bell, FL, was $643,414 in May 2024, compared to $548,033 in May 2023.
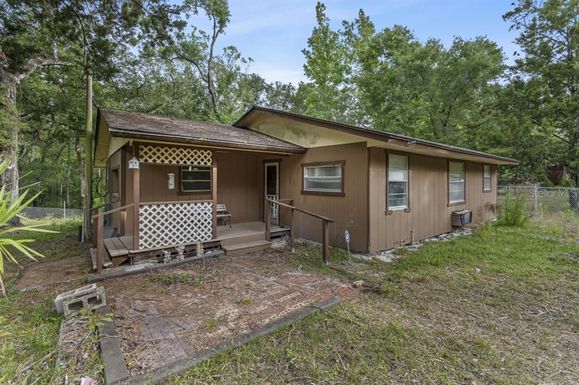
Bell, FL Market Trend for Condos / Townhouses / Penthouses
Average List Price
The average list price of condos/co-ops in Bell, FL, was $594,284 in May 2024, compared to $492,627 in May 2023.
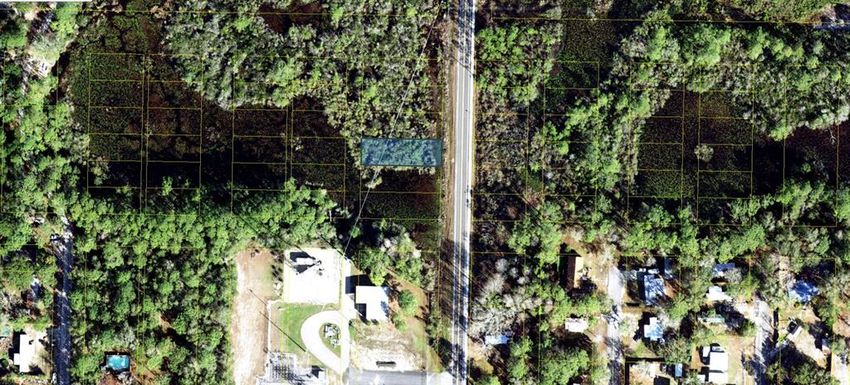
Bell, FL Market Trend for Lots/Land
Average List Price
The average list price of lots/land in Bell, FL, was $389,624 in May 2024, compared to $366,286 in May 2023.
Bell, FL Market Trend for Commercial
Average List Price
The average list price of commercial in Bell, FL, was $1,512,261 in May 2024, compared to $1,378,998 in May 2023.
Bell, FL Housing Market Analysis
The average list price in Bell, FL is $643,166. The average list price in Bell, FL went up 10.16% from 2023 to 2024. Bell, FL home resale inventories is 545, which increased 50.14% since 2023. The average list price per square foot in Bell, FL is $299. 2023 it was $254.