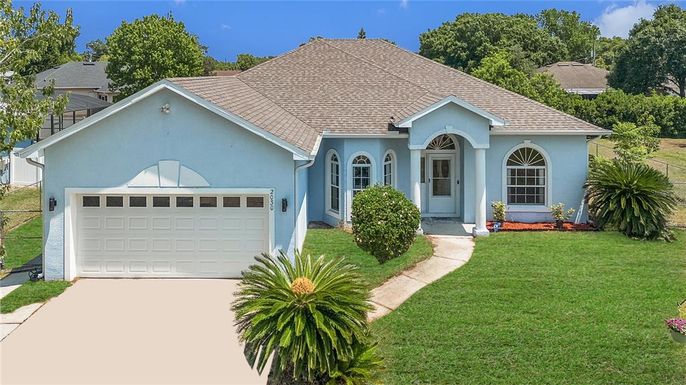
In May 2024, 34769, FL homes were selling for an average price of $327,220, 34769, FL homes on average sell after 38 days on the market compared to 30 days last year. There were 524 homes sold in 34769, FL for May 2024, compared to 521 last year.
The average list price of 34769, FL, was $478,846 in May 2024, compared to $384,625 in May 2023.
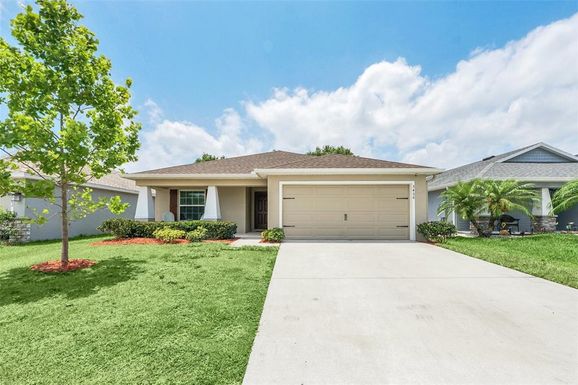
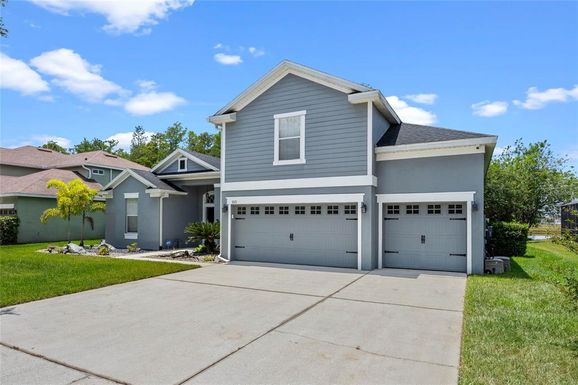
34769, FL Market Trend for Houses
Average List Price
The average list price of houses in 34769, FL, was $430,732 in May 2024, compared to $348,850 in May 2023.
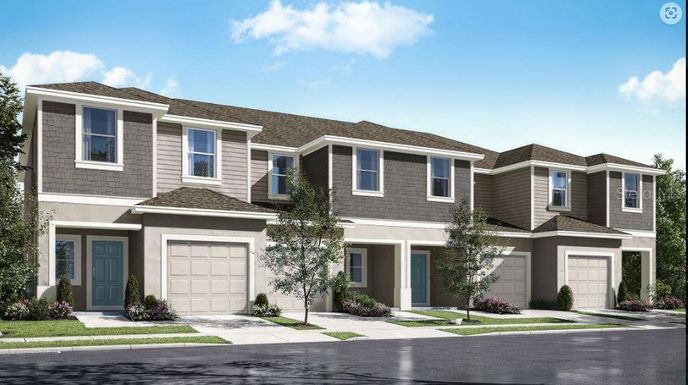
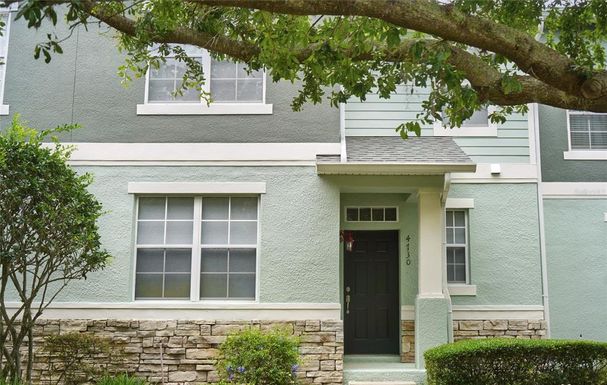
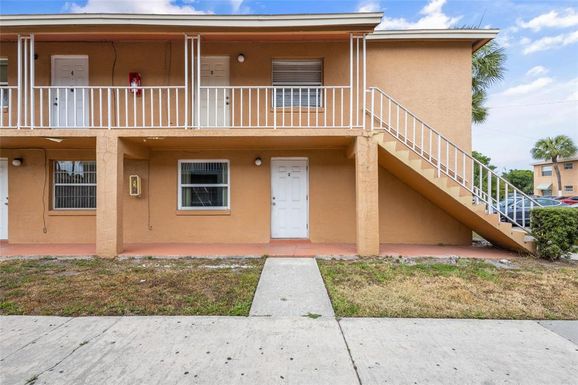
34769, FL Market Trend for Condos / Townhouses / Penthouses
Average List Price
The average list price of condos/co-ops in 34769, FL, was $258,253 in May 2024, compared to $309,533 in May 2023.
34769, FL Market Trend for Lots/Land
Average List Price
The average list price of lots/land in 34769, FL, was $818,478 in May 2024, compared to $729,989 in May 2023.
34769, FL Market Trend for Commercial
Average List Price
The average list price of commercial in 34769, FL, was $633,655 in May 2024, compared to $459,600 in May 2023.
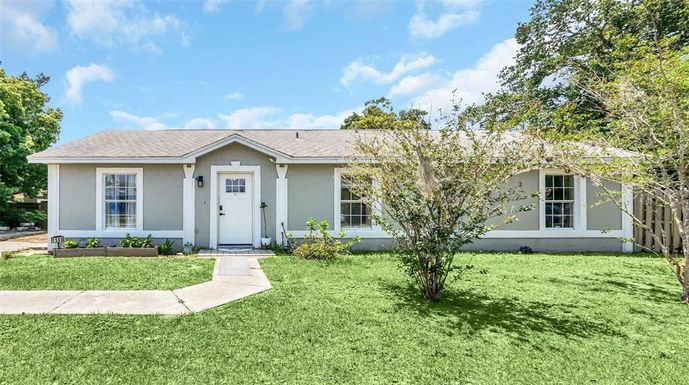
34769, FL Housing Market Analysis
The average list price in 34769, FL is $478,846. The average list price in 34769, FL went up 24.34% from 2023 to 2024. 34769, FL home resale inventories is 141, which decreased 4.73% since 2023. The average list price per square foot in 34769, FL is $310. 2023 it was $246.