In May 2024, 34743, FL homes were selling for an average price of $360,479, 34743, FL homes on average sell after 32 days on the market compared to 26 days last year. There were 344 homes sold in 34743, FL for May 2024, compared to 452 last year.
The average list price of 34743, FL, was $503,733 in May 2024, compared to $341,594 in May 2023.
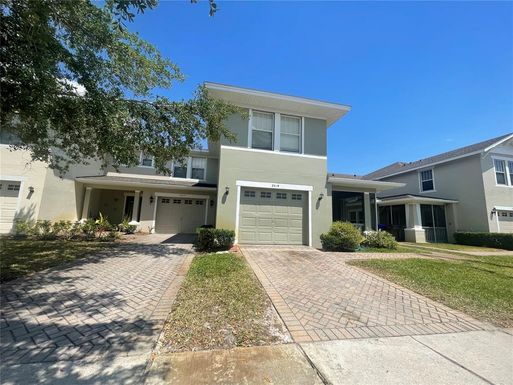
34743, FL Market Trend for Houses
Average List Price
The average list price of houses in 34743, FL, was $401,300 in May 2024, compared to $361,164 in May 2023.
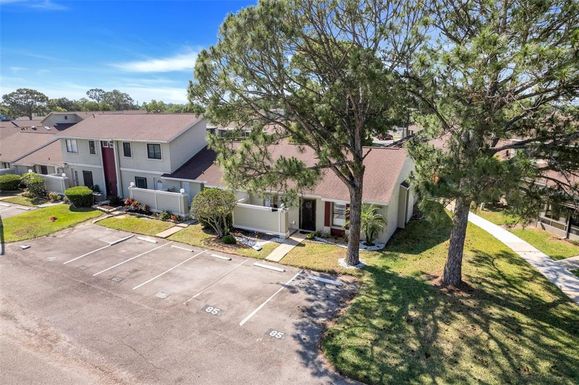
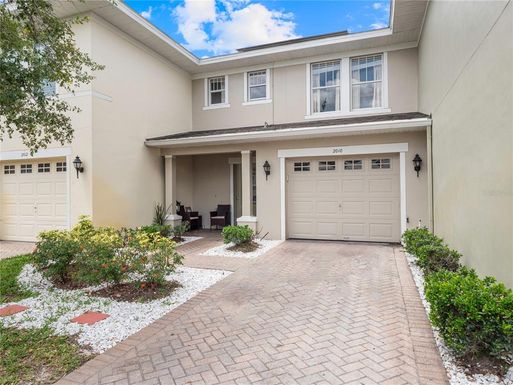
34743, FL Market Trend for Condos / Townhouses / Penthouses
Average List Price
The average list price of condos/co-ops in 34743, FL, was $307,400 in May 2024, compared to $274,489 in May 2023.
34743, FL Market Trend for Lots/Land
Average List Price
The average list price of lots/land in 34743, FL, was $2,200,000 in May 2024, compared to $0 in May 2023.
34743, FL Market Trend for Commercial
Average List Price
The average list price of commercial in 34743, FL, was $1,000,000 in May 2024, compared to $199,900 in May 2023.
34743, FL Housing Market Analysis
The average list price in 34743, FL is $503,733. The average list price in 34743, FL went up 48.14% from 2023 to 2024. 34743, FL home resale inventories is 39, which decreased 48.00% since 2023. The average list price per square foot in 34743, FL is $241. 2023 it was $233.