In May 2024, 34759, FL homes were selling for an average price of $278,933, 34759, FL homes on average sell after 80 days on the market compared to 47 days last year. There were 1355 homes sold in 34759, FL for May 2024, compared to 1450 last year.
The average list price of 34759, FL, was $249,765 in May 2024, compared to $242,393 in May 2023.
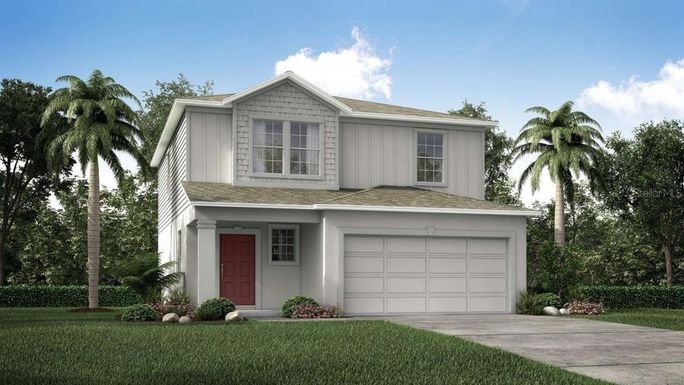
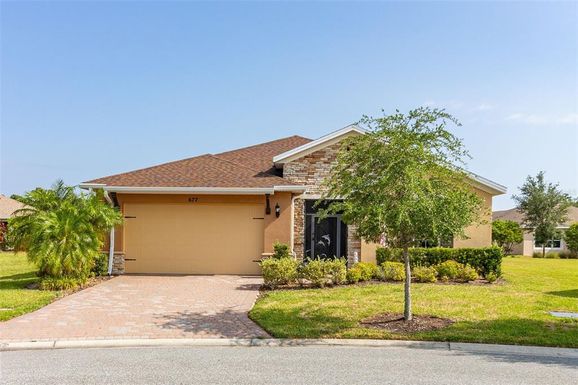
34759, FL Market Trend for Houses
Average List Price
The average list price of houses in 34759, FL, was $326,445 in May 2024, compared to $323,629 in May 2023.
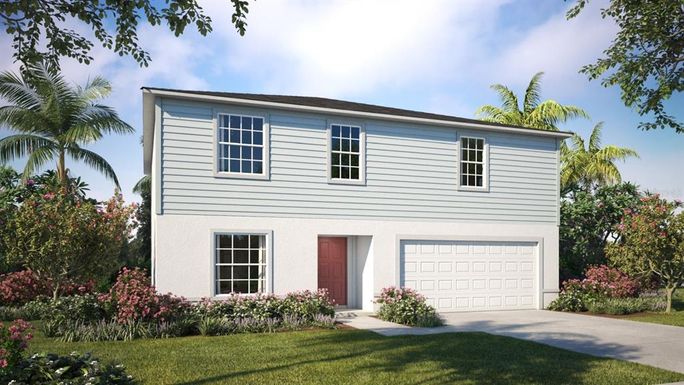
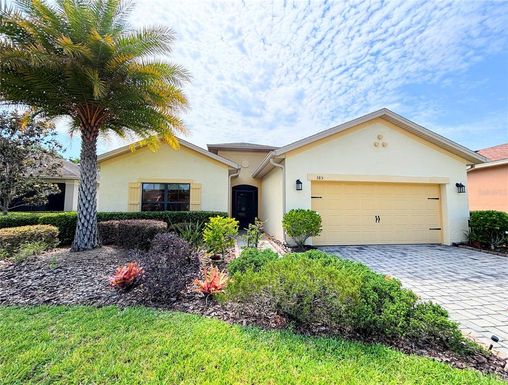
34759, FL Market Trend for Condos / Townhouses / Penthouses
Average List Price
The average list price of condos/co-ops in 34759, FL, was $286,042 in May 2024, compared to $264,617 in May 2023.
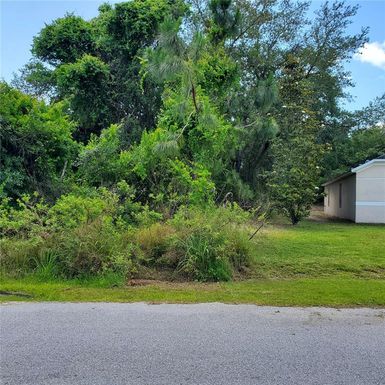
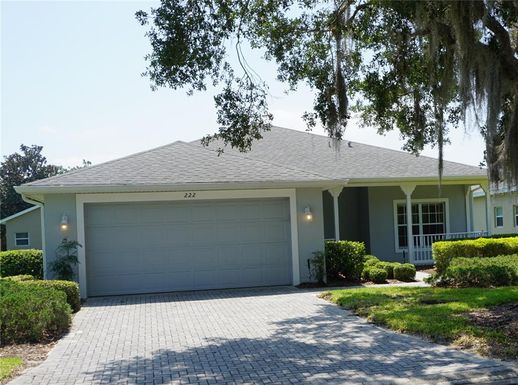
34759, FL Market Trend for Lots/Land
Average List Price
The average list price of lots/land in 34759, FL, was $72,167 in May 2024, compared to $53,890 in May 2023.
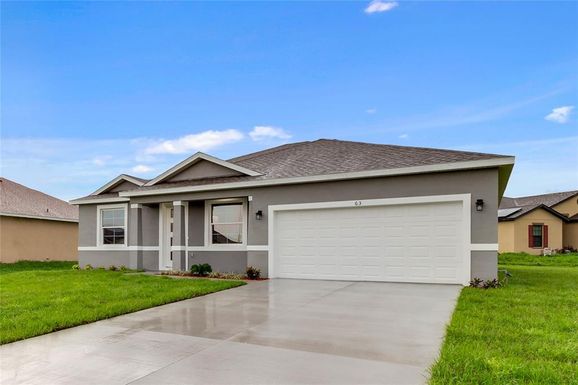
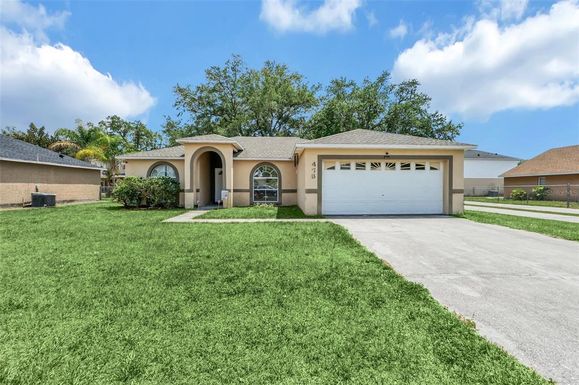
34759, FL Market Trend for Commercial
Average List Price
The average list price of commercial in 34759, FL, was $405,000 in May 2024, compared to $120,483 in May 2023.
34759, FL Housing Market Analysis
The average list price in 34759, FL is $249,765. The average list price in 34759, FL went up 3.86% from 2023 to 2024. 34759, FL home resale inventories is 760, which increased 14.80% since 2023. The average list price per square foot in 34759, FL is $194. 2023 it was $188.