In May 2024, 34215, FL homes were selling for an average price of $1,288,586, 34215, FL homes on average sell after 72 days on the market compared to 40 days last year. There were 26 homes sold in 34215, FL for May 2024, compared to 27 last year.
The average list price of 34215, FL, was $1,080,165 in May 2024, compared to $1,912,500 in May 2023.
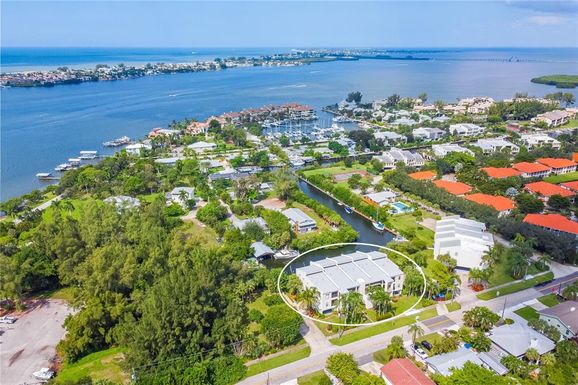
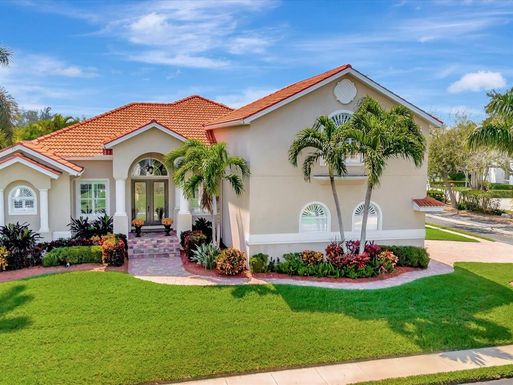
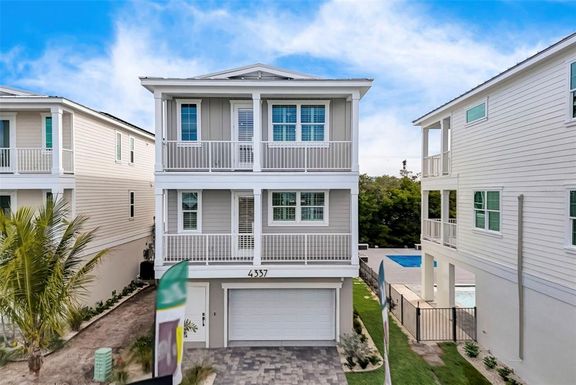
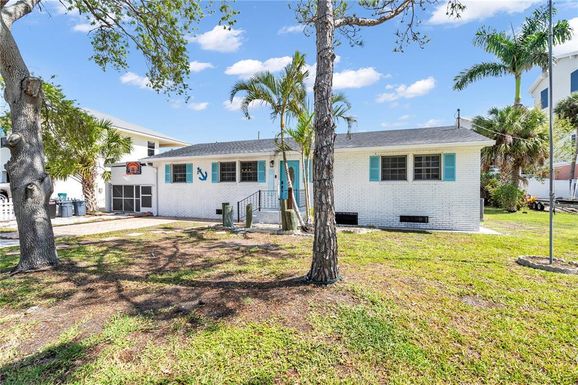
34215, FL Market Trend for Houses
Average List Price
The average list price of houses in 34215, FL, was $1,196,100 in May 2024, compared to $2,095,000 in May 2023.
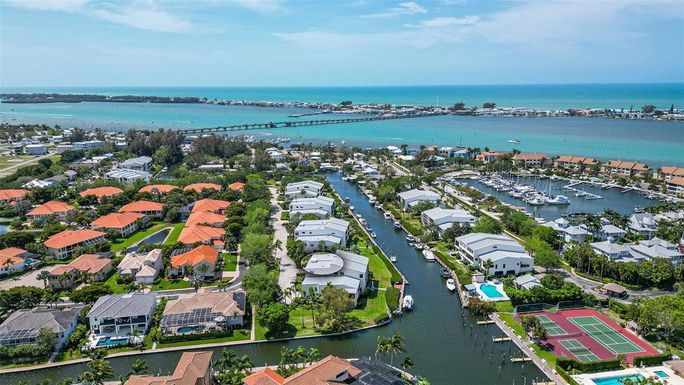
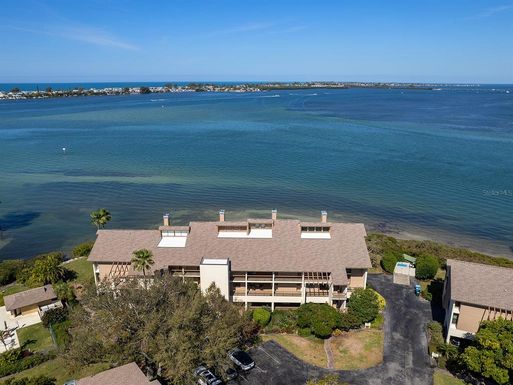
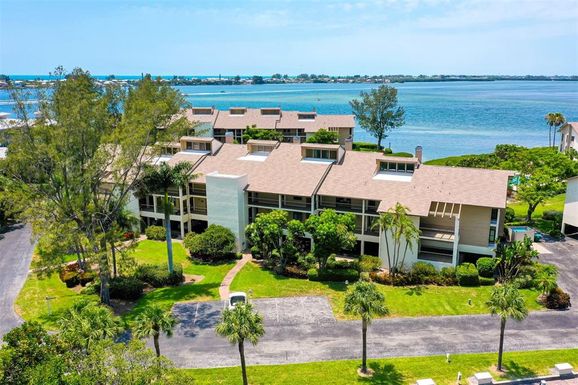
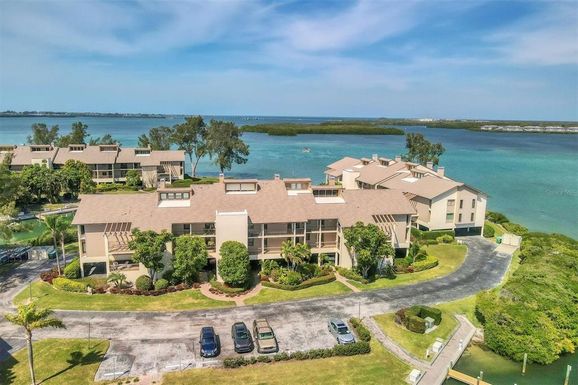
34215, FL Market Trend for Condos / Townhouses / Penthouses
Average List Price
The average list price of condos/co-ops in 34215, FL, was $949,250 in May 2024, compared to $999,999 in May 2023.
34215, FL Market Trend for Lots/Land
Average List Price
The average list price of lots/land in 34215, FL, was $0 in May 2024, compared to $0 in May 2023.
34215, FL Market Trend for Commercial
Average List Price
The average list price of commercial in 34215, FL, was $0 in May 2024, compared to $0 in May 2023.
34215, FL Housing Market Analysis
The average list price in 34215, FL is $1,080,165. The average list price in 34215, FL went down 33.93% from 2023 to 2024. 34215, FL home resale inventories is 17, which increased 240.00% since 2023. The average list price per square foot in 34215, FL is $562. 2023 it was $766.