In May 2024, 34243, FL homes were selling for an average price of $482,346, 34243, FL homes on average sell after 49 days on the market compared to 33 days last year. There were 587 homes sold in 34243, FL for May 2024, compared to 653 last year.
The average list price of 34243, FL, was $540,408 in May 2024, compared to $470,388 in May 2023.
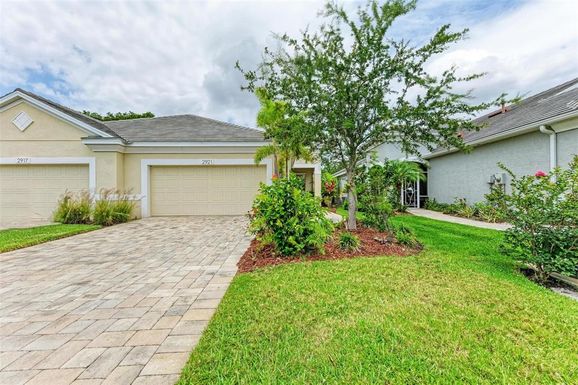
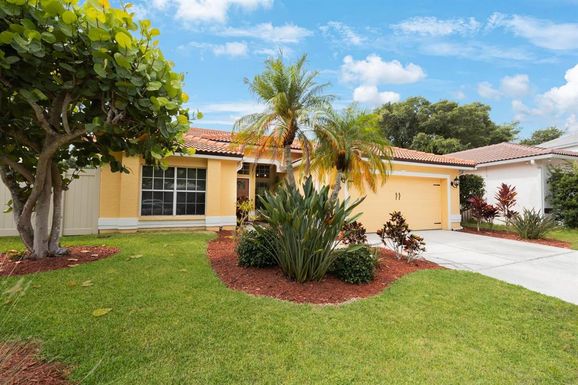
34243, FL Market Trend for Houses
Average List Price
The average list price of houses in 34243, FL, was $565,828 in May 2024, compared to $521,540 in May 2023.
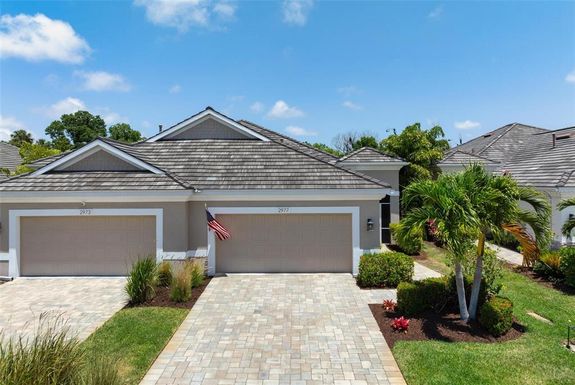
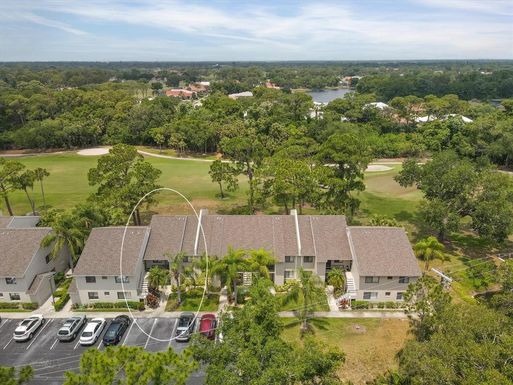
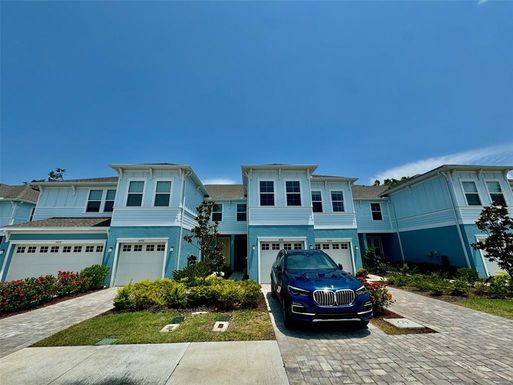
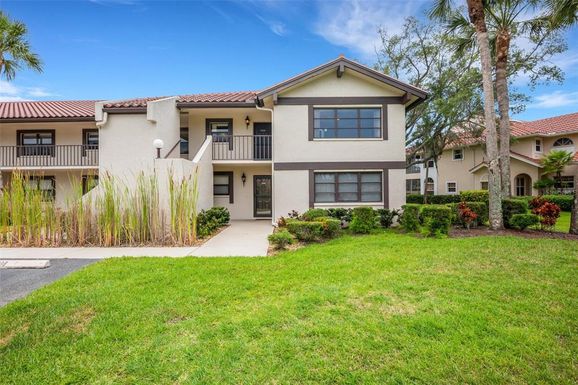
34243, FL Market Trend for Condos / Townhouses / Penthouses
Average List Price
The average list price of condos/co-ops in 34243, FL, was $355,815 in May 2024, compared to $330,473 in May 2023.
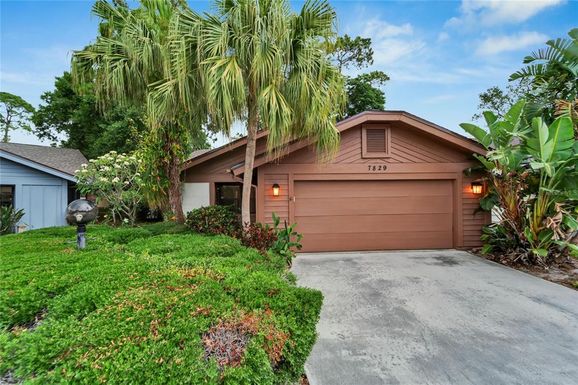
34243, FL Market Trend for Lots/Land
Average List Price
The average list price of lots/land in 34243, FL, was $354,641 in May 2024, compared to $339,105 in May 2023.
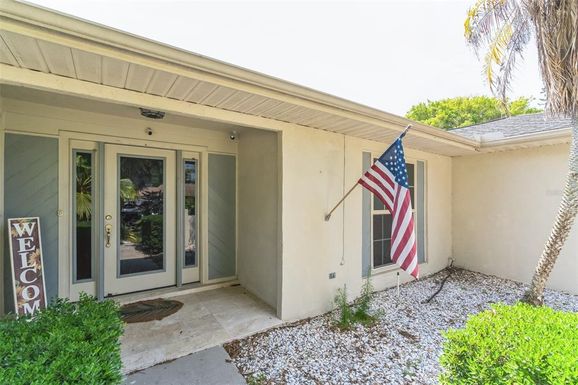
34243, FL Market Trend for Commercial
Average List Price
The average list price of commercial in 34243, FL, was $3,500,000 in May 2024, compared to $1,036,000 in May 2023.
34243, FL Housing Market Analysis
The average list price in 34243, FL is $540,408. The average list price in 34243, FL went up 13.70% from 2023 to 2024. 34243, FL home resale inventories is 222, which increased 45.10% since 2023. The average list price per square foot in 34243, FL is $289. 2023 it was $276.