In May 2024, 34209, FL homes were selling for an average price of $547,645, 34209, FL homes on average sell after 51 days on the market compared to 30 days last year. There were 703 homes sold in 34209, FL for May 2024, compared to 793 last year.
The average list price of 34209, FL, was $599,152 in May 2024, compared to $582,417 in May 2023.
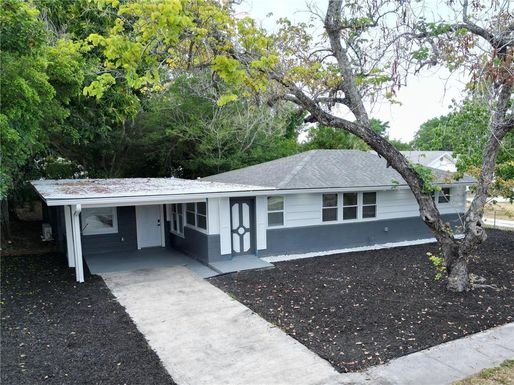
34209, FL Market Trend for Houses
Average List Price
The average list price of houses in 34209, FL, was $832,171 in May 2024, compared to $716,731 in May 2023.
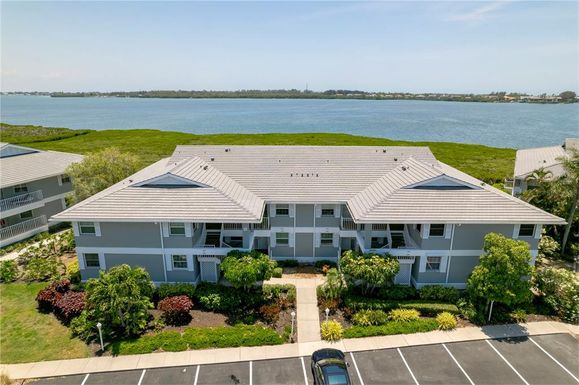
34209, FL Market Trend for Condos / Townhouses / Penthouses
Average List Price
The average list price of condos/co-ops in 34209, FL, was $422,701 in May 2024, compared to $438,075 in May 2023.
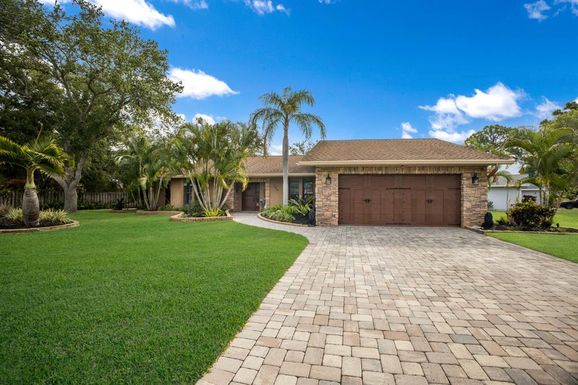
34209, FL Market Trend for Lots/Land
Average List Price
The average list price of lots/land in 34209, FL, was $524,714 in May 2024, compared to $347,500 in May 2023.
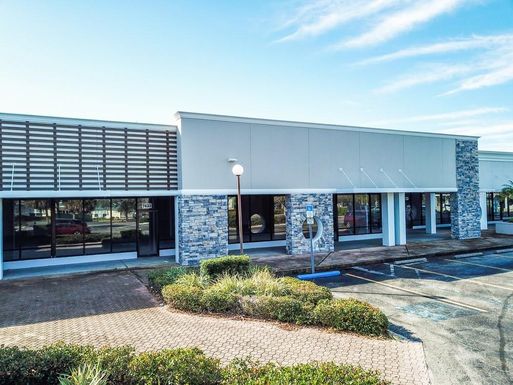
34209, FL Market Trend for Commercial
Average List Price
The average list price of commercial in 34209, FL, was $46,800 in May 2024, compared to $973,400 in May 2023.
34209, FL Housing Market Analysis
The average list price in 34209, FL is $599,152. The average list price in 34209, FL went up 2.90% from 2023 to 2024. 34209, FL home resale inventories is 346, which increased 75.63% since 2023. The average list price per square foot in 34209, FL is $318. 2023 it was $314.